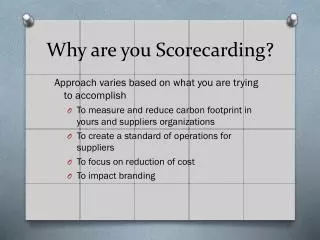
Pragmatic Scorecarding
Pragmatic Scorecarding. Tuesday 15 March, 2005 2pm UK&Ireland/ 3pm Central European/ 9am Eastern US Please join the teleconference call now; if you have any difficulty, contact support@quadstone.com. Starting in 15 minutes. Starting in 10 minutes. Starting in 5 minutes.


Pragmatic Scorecarding
E N D
Presentation Transcript
Pragmatic Scorecarding Tuesday 15 March, 2005 2pm UK&Ireland/ 3pm Central European/ 9am Eastern US Please join the teleconference call now; if you have any difficulty, contact support@quadstone.com. Starting in 15 minutes Starting in 10 minutes Starting in 5 minutes Starting in 2 minutes Starting now
How to ask questions • Return to WebEx Event Manager: • Use Q&A (not Chat): • You can return to full-screen view:
Pragmatic Scorecarding • Presenter: Rob Simpson, PhD, Head of Professional Services Europe • Overview: Practical application of Decisionhouse's scorecarding tools: tips, shortcuts and best practice • Audience: Anyone who builds scorecards with the Quadstone System • Format: A live demo, with slides for sign-posting • Duration: 1 hour
Pragmatic? • Pragmatic: “guided by practical experience and observation rather than theory” • Observations • Thoughts • Tips
bins fields scores (weights) Scorecarding? Apply scorecard
Model Build Historic Customer Data Historic Outcomes Model Apply Customer ID Customer ID Current Customer Data Predictions Outcomes Decision Predictive modeling
Roadmap • Prepare your focus • Analyse your data and problem • Model your objective • Deploy and monitor your model
Preparing the focus Prepare– Analyse – Model – Deploy • “Model as you will deploy” • Defining your modelling population • Defining your objective • Defining your deployment population • Create training and test data sets
Defining your modelling pop`n Prepare – Analyse – Model – Deploy • Remove undeployables • Generally ‘Bads’, unmailable, staff, • Ineligible for offer (but leave your targets in!) • Make selections explicit – fieldify • Transparency • Reproducible • Recorded • FDL:Tenure > 3 and not(Handset eq "Siemens“)
Defining your objective Prepare – Analyse – Model – Deploy • Often underestimated • If in doubt, consider the future deployment • General value model? • Specific campaign, single use? • Create Profile and Audit
Defining your deployment pop`n Prepare – Analyse – Model – Deploy • Usually “ModelPopn and X” where X encompasses: Not existing targets, holders, churners… Campaign specific selections (tenure, region…) • Again, fieldify.
Creating training and test datasets Prepare – Analyse – Model – Deploy • Use a Train / Test methodology - always? • Rebuild using all the data? • Random sample • Or temporal? • What proportions? • Do you care more about your model, or your assessment of the model? • FDL: rndUniform() < 0.5
Before modelling Prepare – Analyse – Model – Deploy • Examining the data • Adding value • Binning
Examining the data Prepare – Analyse – Model – Deploy • Use the business • Bring out legislative, strategic, historic issues • Use visualisation • Equal range binnings are more natural for visualisation • Use colour, height and depth to suit • Become familiar with fields • If a field is difficult to immediately understand, then change it – derivation, labels, binnings…
Examining fields Prepare – Analyse – Model – Deploy • Think of the deployment • Volatility • Is this field likely to change? (Product holdings) • What is the translation of Jan05? • 2 months previous? • Post Christmas? • Carlisle floods? • Training or test population?
Deriving ratios Prepare – Analyse – Model – Deploy • Ratios • FDL: nvl(part,0) / whole • e.g. FDL: nvl(IntCalls,0) / AllCalls • Bounded [0-1] • 0 means all calls are domestic • 1 means all calls are international • Null means no calls were made at all • note nvl substitution
Deriving trends Prepare – Analyse – Model – Deploy • Trends • FDL: nvl(after,0)/(before+after) • e.g. FDL: nvl(Feb,0)/(Jan+Feb) • Bounded [0-1] • 0 means all calls were January (gone to zero) • < 0.5 means there was a decreasing trend • > 0.5 means there was an increasing trend • 1 means all calls were made in Feb • Null means no calls were made in either month
Deriving portfolios Prepare – Analyse – Model – Deploy • Portfolios • Where you have a number of products/features • Build a string showing a portfolio • FDL: concat( if SMS_enabled then "S" else "-", if MMS_enabled then "M" else "-", if java_enabled then "J" else "-", if data_enabled then "D" else "-") • Results in “SMJ-”, “S---”, “S--D” etc.
Binning Analysis Candidates Prepare – Analyse – Model – Deploy • On training set? • Equal population generally more useful for model building • How many bins?
Confidence – a diversion Prepare – Analyse – Model – Deploy …
Population size Prepare – Analyse – Model – Deploy • How many observations do we need? • How confident do we want to be? • Binomial confidence intervals • Useful for binary objectives
If I see 5 responses out of 500 contacts… Prepare – Analyse – Model – Deploy Observed mean is 1%
If I see 5 responses out of 500 contacts… Prepare – Analyse – Model – Deploy Observed mean is 1% But I can only be reasonably sure* that it is somewhere between 0.33% and 2.33% *sure = 95% confident…
So I collect more observations… Prepare – Analyse – Model – Deploy
So I collect more observations… Prepare – Analyse – Model – Deploy
How many do I need? Prepare – Analyse – Model – Deploy • How accurate do you want to be? • The number of responses is more important than the population size • A useful rule – “a rule of 50” • 50 responses gives an estimate to ± 25% pretty much irrespective of response rate • 300 responses, ± 10% • 35,000 responses, ± 1%
How many do I need? Prepare – Analyse – Model – Deploy • NB. 25% error means 25% of (say) 5% mean
Rule of 50 Prepare – Analyse – Model – Deploy • If we have 2% response rate, we want a population size of : 50 / 2% = 2500 • i.e. we expect about 50 responses in a sample of 2,500 • Useful for decision tree nodes • Useful for deciding how many bins
How many bins? Prepare – Analyse – Model – Deploy • Something in the region of: Pop’n * response rate / 50 e.g. 50,000 * 2% / 50 = 20
Back to binnings Prepare – Analyse – Model – Deploy • Start with a few bins • Start with equal population • Imagine the function you are trying to map • Going up? • Going up and down? • Going all over the place? • Categoricals • Merge according to business sense • Robustness • Test across test/train divide
Build an initial scorecard Prepare – Analyse – Model – Deploy • Look for contaminated fields • Sort by Gini, descending • Look at best fields – are they plausible? • Look at the of number of bins a field has • Look at the correlation matrix
Build a scorecard step-by-step Prepare – Analyse – Model – Deploy • Exclude all analysis candidates • Bring in one-by-one • Record each new field, and overall Gini… • … for training and test data • Do not rebuild on test data! • Remember to go back to the training data!!
Build a scorecard step-by-step Prepare – Analyse – Model – Deploy
Record the steps Prepare – Analyse – Model – Deploy • Until performance tails off…
Monitoring a scorecard Prepare – Analyse – Model – Deploy • Monitoring Results • Are the predictions working? • How long do we have to wait? • How often?
Monitoring a scorecard Prepare – Analyse – Model – Deploy • Monitoring scored population • Take a benchmark • Monitor • Analysis candidate fields • Reporting fields • Scores • Using the audit tool to record a baseline • Use equal pop’n bins where possible • Refresh new data with old template
Where to find out more • Quadstone Methodologies, available under our EPM (Enterprise Practice Manager) program • Quadstone System Help • Quadstone System Support website: http://support.quadstone.com/ • Predictive Modeling and advanced scorecarding training courses: contact support@quadstone.com
After the webinar • These slides are available via www.quadstone.com/training/webinars/ • Any problems or questions, please contact support@quadstone.com
Upcoming webinars See www.quadstone.com/training/webinars/. If there’s a webinar topic you’d like to see, please let us know via support@quadstone.com.
Your feedback Please email support@quadstone.com