Roberto Chierici - CERN
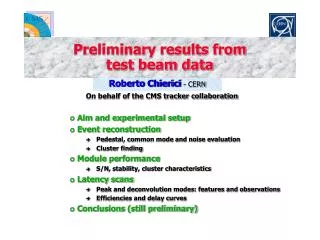
Roberto Chierici - CERN. Preliminary results from test beam data. On behalf of the CMS tracker collaboration. Aim and experimental setup Event reconstruction Pedestal, common mode and noise evaluation Cluster finding Module performance S/N, stability, cluster characteristics

Roberto Chierici - CERN
E N D
Presentation Transcript
Roberto Chierici- CERN Preliminary results from test beam data On behalf of the CMS tracker collaboration • Aim and experimental setup • Event reconstruction • Pedestal, common mode and noise evaluation • Cluster finding • Module performance • S/N, stability, cluster characteristics • Latency scans • Peak and deconvolution modes: features and observations • Efficiencies and delay curves • Conclusions (still preliminary)
Experimental setup 25-Oct-2001/3-Nov-2001 25 ns bunch spacing 120 GeV , Pitch=183 m w/p~0.25 Sensor width=500 m V=300 V 100 mrad Non irradiated TOB modules Almost final DAQ setup 1 2 3 4 5 6 Roberto Chierici
Event Reconstruction • Rough pedestal ped0 (n0 events) • <ADCi> in time • Refined pedestals and first common mode noise (n1 events) • <ADCi>, ADC in time removing strips with pol×(ADCi-ped0)>threshold • CMN0=<ADCi-pedi>over strips • Noise determination and better pedestals/CMN (n2 events) • Exclude those strips for which pol×(ADCi-pedi)>KADC • CMN=<ADCi-pedi>over strips; pedi= <ADCi-CMN> in time • ni2= <ADCi-pedi-CMN>2 in time • Loop over events • Remove bad events, determine noisy/dead strips • Recalculate CMN; update pedestals and noise after n0+n1+n2 events • Cluster finding • si=ADCi-pedi-CMNi consider only those for which si/ni>2 • Good clusters if nstrip>0, Scl1/Ncl1>5 Roberto Chierici
Pedestals Module 1 Module 2 Module 3 Module 4 deconvolution Module 5 Module 6 Module 2 APV 1 APV 2 APV 3 APV 4 Plots from G. Pásztor Roberto Chierici
Noise Noise < 3 ADC counts Very stable in space and time Module #2: noise for two different updating windows N depends upon the updating Roberto Chierici
Corrected data • si=ADCi-pedi-CMNi (CMN~0.3noise) • pedestal runs tell us we correctly estimate our noise • deviation of a factor 2 only outside 4 region Pedestal run =1.04 Roberto Chierici
Cluster characteristics Unexpectedly large number of strips per cluster ! • Confirmed by different analyses (Pisa) • Effect not present in July 2000 beam test (but very different settings) Module #2 S/Ncluster~20 APV 1 APV 2 APV 3 APV 4 From Pisa group Roberto Chierici
Latency scans Runs in deconvolution mode • Detectors 1-2-5-6 kept at optimal latency value • Latency scans for detectors 3-4 • Excellent way for studying delay curves and efficiency • Preliminary 1D tracking • Use 15k muons for alignment of modules (fits to residuals) • Modules 3-5 (4-6) aligned with respect to 1 (2) • Look for coincident clusters in modules 1-5 (2-6) and build a “track” :) • Look what happens around the intercept (10 strips) in modules 3 and 4 • Averaging over events • Scans of all APVs. • Alignment procedure as above • Tracking gives worse performance: use the highest strip in module Runs in peak mode Roberto Chierici
Delay curves q in 10strips from the intercepts in modules 3,4 • no cluster finding dependence deconvolution Non-ideal APV parameters (VFS=70, Isha=90) • asymmetry • too efficient 25 ns off peak • undershoots undershoot... Roberto Chierici
Amplitudes in time Deconvolution Peak Roberto Chierici
Strips in cluster Peak Symmetric charge sharing (Y) Mode CAC Cb q L Cint Cb Q C Cint q R preampl. shaper Cb Asymmetric diffusion (X) q1 q2 latency Diffusive component ~ 20% of the total Roberto Chierici
Delay curves per strip (peak) |L-R|/(L+R+T)<0.2 Test beam data • ‘faster’ curve for adjacent strips • signal propagating on 2 closest strips X-checked by lab calibration • very similar peak ratios (L. Mirabito) Cal. channel 1 2 Roberto Chierici
Delay curve per strip (deco) Reasonable shape of the hit strip • deconvolution nicely tuned |L-R|/(L+R+T)<0.2 Different output for the neighboring: • result of the different pulse shape (input to the deco not anymore a CRRC 50 ns) • deconvolution enhances q1/q0 Possible explanation given by the behaviour of the amplifier as R at high frequency: • +Cint=h.p. filter to adjacent strips =delay curve • The shape is expected to be APV parameter dependent ! Consequences for the tracker: • position resolution • cluster reconstruction • two track separation • data volume • studies going on... Roberto Chierici Delay (ns)
Cluster finding efficiency ~99.5% Still too efficient at 25 ns • better tuning of APV parameters Excellent efficiency at 75 ns (mod. 3) • not too sensitive to the position of the maximum • cluster finding much more efficient than charge integral Cluster finding cuts to be optimized… • efficiency curve can be adjusted • the efficiency ‘plateau’ can be considerably smaller Roberto Chierici
Response function Charge sharing Diffusive regions • The response function can be determined by assuming a uniform beam intensity • over the strip: • diffusion region • position resolution • (work is going on…) Roberto Chierici
Conclusions • The 25 Oct - 3 Nov test beam on 25 ns beam was a success • 6 TOB modules tested on a 25 ns beam with the next-to-final DAQ setup • excellent quality of the collected data • Several configurations tried • latency scans in peak and deconvolution • latency scans with different APV parameters • special triggers • Preliminary results very interesting • S/N of clusters ~ 20 (deco, non irradiated detectors), noise as expected • work going on for optimizing delay curves. Excellent track efficiency • CintAPV at high frequency may cause undesired features (not dramatic) • A lot of things to do... • Huge amount of data (340 GB on castor) to analyze • optimize/distribute common tools for data analysis • further investigations + lab tests to be continued • Everyone very welcome to join ! Roberto Chierici
Further info Module #2 Roberto Chierici
Two events • Zero suppressed info Module tilting visible Roberto Chierici
Deconvolution... RC(2) CR-RC(1) deconvolution 2=100 ns 2=50 ns 2=25 ns Roberto Chierici
DAQ setup Roberto Chierici
Shape vs amplitude • Pulse height ratios are stable for different input amplitudes. Amplitude Roberto Chierici
Diffusion and sharing Deconvolution Peak Roberto Chierici
Some (nice) picture... Roberto Chierici
Charge asymmetry in time Deconvolution Peak Roberto Chierici
Charge sharing in time Deconvolution Peak Roberto Chierici
Aim • Experimental setup (hardware and software) • Event reconstruction • Pedestal and common mode • Noise evaluation • Cluster finding • Module performance • S/N and stability • Cluster characteristics • Latency scans • Peak and deconvolution mode: features • Efficiency and delay curves per strip • New observations • Resolution curve • Conclusions (preliminary!) Roberto Chierici
From Pisa group Roberto Chierici
7 entries per track From Pisa group Roberto Chierici
Special runs • Trigger changed from 1001 to 0011 • another way to study efficiency off peak 2nd cluster <n>~1.86 <n>~1.55 Roberto Chierici
Further crosschecks (Pisa) July 2000 November 2001 Roberto Chierici
S/N in cluster • Pisa results Roberto Chierici