Download
1 / 39
390 likes | 518 Vues
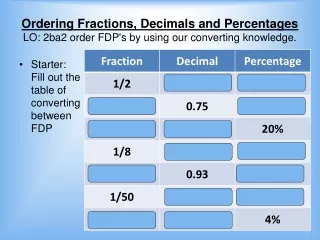
Review the pages of the notebook Fill out key to Cornell. 12 Date 9/12. THRU: Title page Chapter 3. 13. Brainstorming facts about earth 10 things. OUT : 3 things you learned today. Page 12. Bell work question. Pg 13 Title Page for Ch. 3. Write the title “Mapping”. pg13.

E N D
Review the pages of the notebook Fill out key to Cornell
12 Date 9/12 THRU: Title page Chapter 3 13 Brainstorming facts about earth 10 things OUT: 3 things you learned today
Page 12 Bell work question
Pg 13Title Page for Ch. 3 • Write the title “Mapping”.
pg13 Earth Circle Map Read “What is the Earth Like?” and create a circle map about the Earth • 10 facts • From reading! EArth Earth
14 Date THRU: word map labeled 15 IN: Questions OUT: 3 sentences about the map you labeled
Thru 1:pg 15 World Map • On your large map, label/color each item listed on the following slides.
Label all continents and oceans on your mapColor each continent a different color.
Draw in equator. Label and include degrees.Draw in Prime Meridian. Label and include degrees.
Draw in the Tropic of Cancer and the Tropic of Capricorn. Label and include degrees.Draw in the Arctic Circle and the Antarctic Circle. Label and include degrees.
16 Date THRU: comparison lat and lot 17 IN: Prof. Question Lat Worksheet OUT: 3 things you learned today
Pg17 Latitude/longitude Double Bubble : Create a Double Bubble map comparing and contrasting latitude and longitude.
18 Date THRU: Notes maps 19 IN: Prof question Latitude Long 1-Look left or right look top or bot 2-Find Eq. Fine prime me. 3-Above eq. N Right of P. East Below eq. S Left of P. West OUT: 3 things you learned today
Page 18 Prof. question
Page 18 Steps to find Coordinates Latitude Long 1-Look left or right look top or bot 2-Find Eq. Find prime me. 3-Above eq. N Right of P. East Below eq. S Left of P. West
Latitude/longitude map 20 A A b c d e f g h I J
Cornell Notes--What goes where? Don’t forget the Title Maps Questions go here, in the left hand column. You need to write at least 3 questions Notes go here, in the large right hand column. A 3 + sentence summary down there on the bottom of the last page of notes
Thru 1: pg 19,21 Cornell Notes--Maps
Models • Models are representations of real objects or systems • Allow us to manipulate things that we can’t work with in real life. • Allows us to predict what would happen under different conditions or in the future. • Physical models= a 3 dimensional representation used to show relationships between parts. • Model solar system • Conceptual models= a diagram that shows how the parts of a larger whole are related. • Food web • Mathematical models =based on mathematical equations. • Population next year=(This year’s population+ all births+all people moving in)-(all deaths+all people moving out).
What types of models do we make of the Earth? • Globes are physical models that represent the Earth’s surface. • A map is a flat representation of the curved surface of the Earth. • A conceptual model of the Earth’s surface.
Cartography • Cartography is the science of map making. • Cartographers are scientist who make maps. • Collect data from a lot of sources • Surveys • Remote sensing—the process of gathering and analyzing information about an object without being able to physically touch it.
How do we make maps? • The problem is that it is hard to transfer a curved surface to a flat format. • Map projections –a flat map that that represents the curved surface of the earth. • Distortions always happen in map projections.
Types of Map Projections • A cylindrical projection map is the most common type of map that we see. Imagine placing the movie screen around the globe in a cylinder shape. The projection that results is depicted in this image. Notice that areas close to the equator have very little distortion. However, the closer to the poles that one travels, the more distorted the map becomes. In this example, Greenland appears to be many times larger than it really is. 1. Cylindrical
Types of Map Projections 2. Conic • A conic projection map is created by placing a cone shaped screen on a globe. The resulting projection is more accurate than the cylindrical projection map discussed above. However, the further we travel down the map, the more distorted and less accurate the map becomes.
Types of Map Projections 3. Planar/Azimuthal • A plane projection is created by placing an imaginary screen directly above or below a globe. The image that would result is called a plane projection. This type of map projection is not commonly used.
What are maps used for? • There are all sorts of maps. Here are a few. Road maps Weather maps Satellite maps Geologic maps Soil maps Topographic maps.
Parts of a map • Compass directions • Symbols with legend(list of map symbols and their meanings) • Scale(the relationship between the distance on the map and the actual distance)
Topographic Maps • Topographic maps • Shows the surface shape(topography) of the land. • Uses lines called contour lines to connect areas of equal elevation(height above sea level). • Isograms-line on a map that represents constant or equal values. • Example: Isobars connect areas of the same pressure on a weather map. • Contour interval-the difference in elevation between contour lines. • Relief-the difference in elevation between the highest and lowest point on the map.