Download
1 / 17
170 likes | 299 Vues
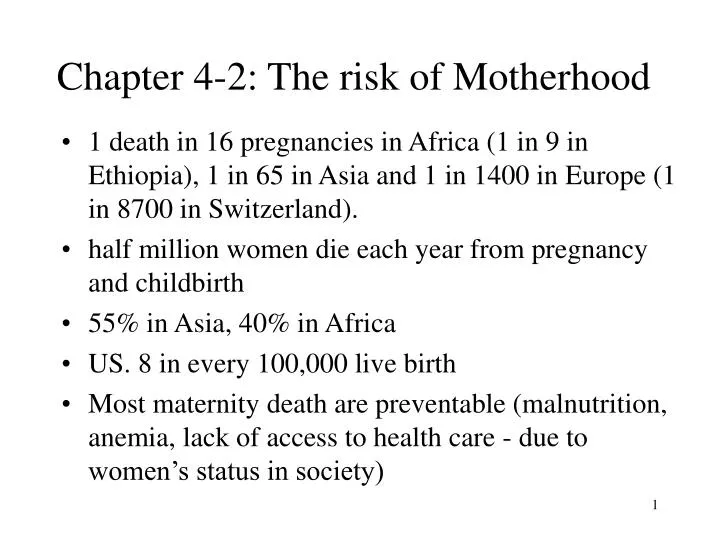
Chapter 4-2: The risk of Motherhood. 1 death in 16 pregnancies in Africa (1 in 9 in Ethiopia), 1 in 65 in Asia and 1 in 1400 in Europe (1 in 8700 in Switzerland). half million women die each year from pregnancy and childbirth 55% in Asia, 40% in Africa US. 8 in every 100,000 live birth

E N D
Chapter 4-2: The risk of Motherhood • 1 death in 16 pregnancies in Africa (1 in 9 in Ethiopia), 1 in 65 in Asia and 1 in 1400 in Europe (1 in 8700 in Switzerland). • half million women die each year from pregnancy and childbirth • 55% in Asia, 40% in Africa • US. 8 in every 100,000 live birth • Most maternity death are preventable (malnutrition, anemia, lack of access to health care - due to women’s status in society)
Population Pyramid • What you can get from this pyramid? - impact of baby booms, wars, pop policy, external migrations.. • Poor countries - proportion of female is lower (contrast to developed) • Austria - much more senior female • Russia - impact of wars • Percentage of pop in each age group strongly influences demand for goods and services within that country’s economy - more young need education/health facilities • Rate of Natural Increase = CBR - CDR (no migration)
Figure 4-12- The progression of the “boomers” • The baby boom cohort born between 1946 and 1964 – through the US pop pyramid has been associated with changing American lifestyles and expenditure patterns. In 1970, national priorities focused on childhood and young adult interests and the needs, education, and support of younger age groups. At the turn of the 21st century, boomers formed the largest share of the working pop, and their wants and spending patterns shaped the national culture and economy. By 2030, the pyramid foretells, their desires and support needs – now for retirement facilities and old-age care will again be central concerns.
Census Bureau – population pyramid • Link (http://www.census.gov/ipc/www/idbpyr.html) China - boys preference and one-child policy causes 1 million excess males a year ,entering marriage market beginning about 2100. (never-married men outnumber their female counterparts by 2 to 1) social problems,..
Demographic Transition (fig 4-17) • Change of population associated with industrialization and urbanization • Fit Western Europe from agricultural to urban-developed countries, may not reflect truth in developing countries. • Stage 1: variable growth, replacement process-from a.d. 1 to a.d. 1650 • Stage 2: death rate drops and birth rate still high, 1750 in W. Europe (now in Saudi Arabia, Nicaragua) • Stage 3: birth rate drops, pop begin to level off • Stage 4: very low birth and death rates.
Convergence in fertility • High TFR in sub-Saharan and northern India will provide majority of world population growth to at least 2050. • Low TFR will have better life • High TFR consume social resources
The Cairo Plan • abandoned population control • giving women more control - increased educational access and economic opportunity for women and falling • fund to stabilize population - Developing countries to pay 2/3, 1/3 to be paid by developed countries, so far 70% of 2/3 paid and only 35% of 1/3 paid, U.S. failed to meet its agreed contribution.
Population Relocation • in the past, emigration affected countries population (fig 4.21) • In recent decades, only Afghanistan, Cuba, El Salvador, and Haiti have as many as 10% of the population emigrated. • migrants add an unbalanced age and sex component to the group they join, heavily skewed in favor of young singles.
Population Density • Unevenly distributed - Four clusters: East Asia, South Asia, Europe and NE US and SE Canada • US concentration,N and W Europe • Large pop in small part of land: >50% in <5% land, 9/10 in < 20% land • Most in lowerland • 2/3 of pop within 300 mi of the ocean • East Asia - China,Japan, Taiwan and S Korea • South Asia - India, Bangladesh, Pakistan and Sri Lanka, plus Thailand, Cambodia, Indonesia, and Malaysia... • Ecumene - nonecumene: case of settlement in the nonecumene world is Andes Mountains and Mexico plateau
Population Density - 2 • Crude (arithmetic) density - misleading • Physiological density - population over area of arable land, assuming all arable land is equally productive and comparably used. (Table 4.4) • Country Crude Density Phy. Density • Australia 6 105 • Bangladesh 2305 3814 • China 344 3419 • Egypt 177 5418 • Japan 870 7433 • U.S. 80 380
Carrying Capacity • Overcrowding is a reflection of carrying capacity of a country not density. • Carrying Capacity - number of people an area can support on a sustained basis given the prevailing technology. (irrigation/fertilizing vs. slash-and-burn) • Sub-Saharan countries with pop increase and food production decreased. (fig 4.26)
Urbanization • More world pop increase in urban area. • 750 million will grow to 2.75 billion by 2030 in urban. • fig 4.27 • fig 4.28
Population Data • Not reliable in some countries due to the isolation, insufficient fund, lack of training, high illiteracy. • Numbers still reported and published • Deaths are less completely reported than births throughout Asia, Africa is less complete and reliable compared to Asia • In many society, birth days are not noted, no western calendar. Chinese 1 year old when born, passing New Year plus another year.
Population Projection • Population Projection - factors taken in account include level of birth rates, literacy, education, govt policy, status of women, disease, socio-development (smaller families) • For Africa - predicting fertility rate is the most important, different results may emerge. • Ignorance of env. factors - soils, vegetation, water supplies, climate ---affecting carrying capacity.
Thomas Malthus • “An Essay on the Principle of Population as It Affects the Future Improvement of Society” - published in 1798 • Population grows at “Geometric rate” and Food supply “Arithmetic rate” • UK would be struck by hunger in 50 yrs.- his prediction, but…it did not occur, Due to.. • Colonization and migration • Food supply grows exponentially
Neo-Malthusianism • J-curve is converted to an S-curve in population growth. (4.30) • Top of the S-curve - population size consistent with and supportable by the resources (equivalent to the carrying capacity) - reached a homeostatic plateau. • Neo-Malthusianism - China/India, policies implemented to control pop. • Africa/Middle East - not respond to Neo-Malthusianism, but Iran developed a family planning program.