Download
1 / 77
790 likes | 975 Vues
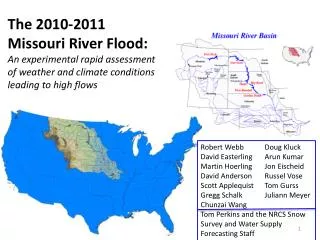
The Extreme East-Central Missouri Flash Flood of 6-7 May 2000 James T. Moore, John P. Gagan Cooperative Institute for Precipitation Systems Department of Earth and Atmospheric Sciences Saint Louis University and Fred H. Glass NWSFO St. Charles, MO.

E N D
The Extreme East-Central Missouri Flash Flood of 6-7 May 2000 James T. Moore, John P. Gagan Cooperative Institute for Precipitation Systems Department of Earth and Atmospheric Sciences Saint Louis University and Fred H. Glass NWSFO St. Charles, MO Hydrometeorology Course for RFC/HPCFriday, 8 December 2000
Extreme Heavy Rain in Franklin County, Missouri • Occurred during the nighttime and early hours of 6-7 May 2000 • Rainfall exceeding 4 inches (100 mm) fell over a 5500 km2 area, with embedded amounts over 12 inches (300 mm) • There were two fatalities and property damage of over 100 million dollars • 379 structures damaged or destroyed in Franklin County; declared a disaster area by the President • Flat Creek in Franklin County rose about 15 feet (4.57 m) destroying two mobile home parks.
Infrared Satellite Imagery Valid 1815 UTC 5 May 2000 to 1815 UTC 6 May 2000
NIDS Radar Imagery Valid 0134 to 1800 UTC 6 May 2000 http://www.rap.ucar.edu/staff/pneilley/NIDS_archives.html
24-Hour Precipitation Analysis for the Period Ending 1200 UTC 7 May 2000
GOES-8 Infrared Satellite Loop Valid 1815 UTC 6 May 2000 to 1815 UTC 7 May 2000
Pre-storm Environment • Weakening mid-level cyclonic vortex (MCV) with warm core characteristics moving northeasterly from northeast Oklahoma into central Missouri. • Very moist tropospheric conditions: • 1000-500 mb mean relative humidity values > 80% • Lower tropospheric dewpoints in lower-middle teens ºC • PWs of 1.19 - 1.47 inches (153-216%) • warm cloud depths ranged from 3.1 –3.3 km • Weak instability with CAPEs between 500-1000 J kg-1 • Weak vertical wind shear in the mid-upper levels • Strong Low-Level Jet (LLJ) from the south-southwest (at times exceeding 50 knots)
925 mb surface 7 May 2000 00 UTC ---- Isodrosotherms
925 mb surface 7 May 2000 12 UTC ---- Isodrosotherms
850 mb surface 7 May 2000 00 UTC --- Isotachs
850 mb surface 7 May 2000 12 UTC --- Isotachs
500 mb surface 7 May 2000 00 UTC --- Isotherms
500 mb surface 7 May 2000 12 UTC --- Isotherms
250 mb surface 7 May 2000 00 UTC --- Isotachs
250 mb surface 7 May 2000 12 UTC --- Isotachs
THE EVENT • A mesoscale convective system (MCS) formed near the center of the MCV and created an outflow boundary at the surface • This outflow boundary was weak, due to the very moist atmosphere in which it formed, and moved very little during the nighttime hours of 7 May 2000 • The southwesterly LLJ was strong and wide. It flowed nearly perpendicular to the outflow boundary, veering as time progressed, and acted as a focusing mechanism for convection
THE EVENT (cont.) • The steering flow (from 700 mb to 300 mb) was predominantly westerly, veering as time progressed, and was oriented parallel to the outflow boundary • The nature of the training changed with time from west-east to northwest-southeast in concert with a change in cell motion • This change in cell motion was related to veering of the cloud-layer wind
Surface Analysis Valid 00 UTC 7 May 2000 14 15 13 16 17 11 10 18 10 11 11 12 17 12 13 14 15 16 18
RUC Initialization Composite Chart Valid 12 UTC 6 May 2000 Precipitable Water (1.2 inches) 1000-500mb Mean RH (%) K-Index(28)
RUC Initialization Composite Chart Valid 00 UTC 7 May 2000 Precipitable Water (1.2 inches) 1000-500mb Mean RH (%) K-Index(28)
RUC Initialization Composite Chart Valid 12 UTC 7 May 2000 Precipitable Water (1.3 inches) 1000-500mb Mean RH (%) K-Index(28)
Springfield, MO (SGF) Skew-T Valid 00 UTC 7 May 2000 wcd = 3.02 km
Springfield, MO (SGF) Skew-T Valid 12 UTC 7 May 2000 wcd = 3.27 km
Lincoln, IL (ILX) Skew-T Valid 00 UTC 7 May 2000 wcd = 3.0 km
Lincoln, IL (ILX) Skew-T Valid 12 UTC 7 May 2000 wcd = 3.31 km
RUC Initialization 950 mb to 850 mb Layer-Averaged Wind Vectors and Isotachs Valid 00 UTC 7 May 2000
RUC Initialization 950 mb to 850 mb Layer-Averaged Wind Vectors and Isotachs Valid 03 UTC 7 May 2000
RUC Initialization 950 mb to 850 mb Layer-Averaged Wind Vectors and Isotachs Valid 06 UTC 7 May 2000
RUC Initialization 950 mb to 850 mb Layer-Averaged Wind Vectors and Isotachs Valid 09 UTC 7 May 2000
RUC Initialization 950 mb to 850 mb Layer-Averaged Wind Vectors and Isotachs Valid 12 UTC 7 May 2000
Vertical Wind Profile Display from the KLSX WSR-88D Valid 0600 UTC to 0700 UTC 7 May 2000