Download
1 / 148
1.55k likes | 2.43k Vues
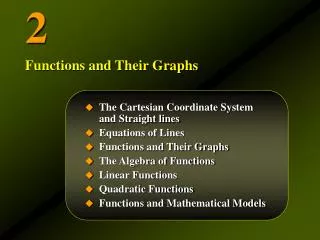
2. The Cartesian Coordinate System and Straight lines Equations of Lines Functions and Their Graphs The Algebra of Functions Linear Functions Quadratic Functions Functions and Mathematical Models. Functions and Their Graphs . 2.1.

E N D
2 • The Cartesian Coordinate System and Straight lines • Equations of Lines • Functions and Their Graphs • The Algebra of Functions • Linear Functions • Quadratic Functions • Functions and Mathematical Models Functions and Their Graphs
2.1 The Cartesian Coordinate System and Straight lines
The Cartesian Coordinate System • We can represent real numbers geometrically by points on a real number, or coordinate, line:
The Cartesian Coordinate System • The Cartesian coordinate system extends this concept to a plane (two dimensional space) by adding a vertical axis. 4 3 2 1 – 1 –2 –3 –4
The Cartesian Coordinate System • The horizontal line is called the x-axis, and the vertical line is called the y-axis. y 4 3 2 1 – 1 –2 –3 –4 x
The Cartesian Coordinate System • The point where these two lines intersect is called the origin. y 4 3 2 1 – 1 –2 –3 –4 Origin x
The Cartesian Coordinate System • In thex-axis, positive numbers are to the right and negative numbers are to the left of the origin. y 4 3 2 1 – 1 –2 –3 –4 Negative Direction Positive Direction x
The Cartesian Coordinate System • In they-axis, positive numbers are above and negativenumbers are below the origin. y 4 3 2 1 – 1 –2 –3 –4 Positive Direction x Negative Direction
The Cartesian Coordinate System • A point in the plane can now be represented uniquely in this coordinate system by an ordered pair of numbers(x, y). y (–2, 4) 4 3 2 1 – 1 –2 –3 –4 (4, 3) x (3, –1) (–1, –2)
The Cartesian Coordinate System • The axes divide the plane into four quadrants as shown below. y 4 3 2 1 – 1 –2 –3 –4 Quadrant II (–, +) Quadrant I (+, +) x Quadrant III (–, –) Quadrant IV (+, –)
Slope of a Vertical Line • Let L denote the unique straight line that passes through the two distinct points (x1, y1) and (x2, y2). • If x1=x2, then L is a vertical line, and the slope is undefined. y L (x1, y1) (x2, y2) x
Slope of a Nonvertical Line • If (x1, y1) and (x2, y2) are two distinct points on a nonvertical lineL, then the slopem of L is given by y L (x2, y2) y2 – y1 = y (x1, y1) x2 – x1 = x x
Slope of a Nonvertical Line • If m > 0, the line slants upwardfromleft to right. y L m = 1 y = 1 x = 1 x
Slope of a Nonvertical Line • If m > 0, the line slants upwardfromleft to right. y L m = 2 y = 2 x = 1 x
Slope of a Nonvertical Line • If m < 0, the line slants downwardfromleft to right. y m = –1 x = 1 y = –1 x L
Slope of a Nonvertical Line • If m < 0, the line slants downwardfromleft to right. y m = –2 x = 1 y = –2 x L
Examples • Sketch the straight line that passes through the point (2, 5) and has slope –4/3. Solution • Plot the point(2, 5). • A slope of –4/3 means that if xincreases by 3, ydecreases by 4. • Plot the resulting point(5, 1). • Draw a line through the two points. y 6 5 4 3 2 1 x = 3 (2, 5) y = –4 (5, 1) x 1 2 3 4 5 6 L
Examples • Find the slopem of the line that goes through the points(–1, 1) and (5, 3). Solution • Choose (x1, y1) to be (–1, 1) and (x2, y2) to be (5, 3). • With x1 =–1, y1 = 1, x2 =5, y2 =3, we find
Examples • Find the slopem of the line that goes through the points(–2, 5) and (3, 5). Solution • Choose (x1, y1) to be (–2, 5) and (x2, y2) to be (3, 5). • With x1 =–2, y1 = 5, x2 =3, y2 =5, we find
Examples • Find the slopem of the line that goes through the points(–2, 5) and (3, 5). Solution • The slope of a horizontal line is zero: y 6 4 3 2 1 (3, 5) (–2, 5) L m = 0 x –2 –1 1 2 3 4
Parallel Lines • Two distinct lines are parallel if and only if their slopes are equal or their slopes are undefined.
Example • Let L1 be a line that passes through the points (–2, 9) and (1, 3), and let L2 be the line that passes through the points (–4, 10) and (3, –4). • Determine whether L1 and L2 are parallel. Solution • The slopem1 of L1 is given by • The slopem2 of L2 is given by • Since m1=m2, the lines L1 and L2 are in fact parallel.
2.2 Equations of Lines
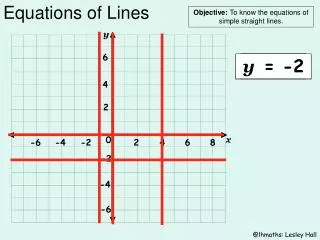
Equations of Lines • Let L be a straight lineparallel to the y-axis. • Then Lcrosses the x-axis at some point(a, 0) , with the x-coordinate given by x = a, where a is a real number. • Any other point on L has the form (a, ), where is an appropriate number. • The vertical lineL can therefore be described as x = a y L (a, ) (a, 0) x
Equations of Lines • Let L be a nonvertical line with a slope m. • Let (x1, y1) be a fixed point lying on L, and let (x, y) be a variable point on L distinct from (x1, y1). • Using the slope formula by letting (x, y) =(x2, y2), we get • Multiplying both sides by x – x1 we get
Point-Slope Form • An equation of the line that has slope m and passes through point (x1, y1) is given by
Examples • Find an equation of the line that passes through the point (1, 3) and has slope 2. Solution • Use the point-slope form • Substituting for point(1, 3) and slopem = 2, we obtain • Simplifying we get
Examples • Find an equation of the line that passes through the points (–3, 2) and (4, –1). Solution • The slope is given by • Substituting in the point-slope form for point (4, –1) and slope m = – 3/7, we obtain
Perpendicular Lines • If L1 and L2 are two distinct nonvertical lines that have slopes m1 and m2, respectively, then L1 is perpendicular to L2 (written L1 ┴L2) if and only if
Example • Find the equation of the line L1 that passes through the point (3, 1) and is perpendicular to the line L2 described by Solution • L2 is described in point-slope form, so its slope is m2 = 2. • Since the lines are perpendicular, the slope of L1 must be m1 = –1/2 • Using the point-slope form of the equation for L1 we obtain
Crossing the Axis • A straight line L that is neither horizontal nor vertical cuts the x-axis and the y-axis at, say, points (a, 0) and (0, b), respectively. • The numbers a and b are called the x-intercept and y-intercept, respectively, of L. y y-intercept (0, b) x-intercept x (a, 0) L
Slope-Intercept Form • An equation of the line that has slopem and intersects the y-axis at the point(0, b) is given by y = mx + b
Examples • Find the equation of the line that has slope3 and y-intercept of –4. Solution • We substitute m = 3 and b = –4 into y = mx + b and get y = 3x – 4
Examples • Determine the slope and y-intercept of the line whose equation is 3x – 4y = 8. Solution • Rewrite the given equation in the slope-intercept form. • Comparing to y = mx + b, we find that m = ¾ and b = –2. • So, the slope is ¾ and the y-interceptis –2.
Applied Example • Suppose an art object purchased for $50,000 is expected to appreciate in value at a constant rate of $5000 per year for the next 5 years. • Write an equation predicting the value of the art object for any given year. • What will be its value3 years after the purchase? Solution • Let x=time (in years) since the object was purchased y=value of object (in dollars) • Then, y = 50,000 when x = 0, so the y-intercept is b =50,000. • Every year the value rises by 5000, so the slope is m = 5000. • Thus, the equation must be y = 5000x + 50,000. • After 3 years the value of the object will be $65,000: y = 5000(3) + 50,000 = 65,000
General Form of a Linear Equation • The equation Ax + By + C = 0 where A, B, and C are constants and A and B are not both zero, is called the general form of a linear equation in the variablesx and y.
General Form of a Linear Equation • An equation of a straight line is a linear equation; conversely, every linear equation represents a straight line.
Example • Sketch the straight line represented by the equation 3x – 4y – 12 = 0 Solution • Since every straight line is uniquely determined by two distinct points, we need find only two such points through which the line passes in order to sketch it. • For convenience, let’s compute the x- and y-intercepts: • Setting y= 0, we find x= 4; so the x-intercept is 4. • Setting x= 0, we find y= –3; so the y-intercept is –3. • Thus, the line goes through the points(4, 0) and(0, –3).
Example • Sketch the straight line represented by the equation 3x – 4y – 12 = 0 Solution • Graph the line going through the points (4, 0) and(0, –3). y L 1 –1 –2 –3 –4 (4, 0) x 1 2 3 4 5 6 (0, –3)
Equations of Straight Lines Vertical line:x = a Horizontal line:y = b Point-slope form:y – y1 = m(x – x1) Slope-intercept form:y = mx + b General Form:Ax + By + C = 0
2.3 Functions and Their Graphs
Functions • A function f is a rule that assigns to each element in a setAone and only one element in a setB. • The setA is called the domain of the function. • It is customary to denote a function by a letter of the alphabet, such as the letter f. • If x is an element in the domain of a function f, then the element in B that f associates with x is written f(x) (read “f of x”) and is called the value of f at x. • The setB comprising all the values assumed by y =f(x) as x takes on all possible values in its domain is called the range of the function f.
Example • Let the function fbe defined by the rule • Find: f(1) Solution:
Example • Let the function fbe defined by the rule • Find: f(–2) Solution:
Example • Let the function fbe defined by the rule • Find: f(a) Solution:
Example • Let the function fbe defined by the rule • Find: f(a + h) Solution:
Applied Example • ThermoMaster manufactures an indoor-outdoor thermometer at its Mexican subsidiary. • Management estimates that the profit (in dollars) realizable by ThermoMaster in the manufacture and sale of x thermometers per week is • Find ThermoMaster’s weekly profit if its level of production is: • 1000 thermometers per week. • 2000 thermometers per week.
Applied Example Solution • We have • The weekly profit by producing1000 thermometers is or $2,000. • The weekly profit by producing2000 thermometers is or $7,000.
Determining the Domain of a Function • Suppose we are given the function y = f(x). • Then, the variable x is called the independent variable. • The variable y, whose value depends on x, is called the dependent variable. • To determine the domain of a function, we need to find what restrictions, if any, are to be placed on the independent variable x. • In many practical problems, the domain of a function is dictated by the nature of the problem.
Applied Example: Packaging • An open box is to be made from a rectangular piece of cardboard 16 inches wide by cutting away identical squares (x inches by x inches) from each corner and folding up the resulting flaps. x 10 10 – 2x x x 16 – 2x x 16