Download
1 / 30
310 likes | 481 Vues
Regional module for Africa: Review and updates. Githaiga Monica Wendy Weng Addis Ababa, Ethiopia 7 November, 2012. Overview. Review of the module Context of initiatives Questionnaire review Launch and release Regional module updates Response rate

E N D
Regional module for Africa: Review and updates Githaiga Monica Wendy Weng Addis Ababa, Ethiopia 7 November, 2012
Overview • Review of the module • Context of initiatives • Questionnaire review • Launch and release • Regional module updates • Response rate • Key indicators and common data reporting issues • Key findings in 2012 data collection
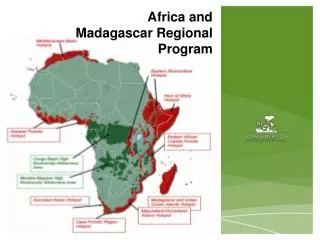
A partnership with Africa Union • Framework of the 2nd Decade of Education for Africa (2006-2015), the AU has committed to monitoring the status of education and the progress made in implementing the 8 priority areas of their plan of action. (http://www.au.int/) • UIS has committed to providing data to the AU Observatory database, managed by the Association for the Development of Education in Africa (ADEA). http://www.adeanet.org/adeaPortal/ • UIS has offered its expertise, infrastructure and technical platforms to collect new data that address AU indicator needs.
Regional module questionnaire and policy relevance Contains 6 tables with items chosen in agreement with regional partners according to well defined criteria: • Relevance to regional monitoring and policy discussion • Identified as high priorities by partners
Item 1: Classes and pupils Class size and multi-grade teaching • The deployment of teachers in classrooms is a key factor affecting learning outcomes especially where class sizes are very large or cover several grades
Item 2: Availability of manuals and textbooks (reading and mathematics) • Textbooks are one of the educational inputs that have the greatest influence on learning achievement in African countries
Item 3: Graduates from pre-service teacher training programmes • The teacher is the corner stone of the quality of teaching in Africa. • This item measures the capacity of countries to produce trained teachers • It is important to assess the need of teachers to be trained to achieve UPE and to ensure quality of education
Item 4: Newly recruited teachers • Countries need to estimate the demand for teachers and to plan their recruitment on an annual basis • This item can be used to measure: • the level of recruitment in a country • teacher turnover (or attrition) • quality of recruited teachers
Item 5: Schools with basic service (toilets, water and electricity) • Availability of sanitation facilities improves the learning environment, improves pupils’ health, boosts attendance and achievement and promotes gender equality • Girls are more likely to attend school where single-sex toilets are available
Item 6: School census response rate • Enable the monitoring of data coverage and the efficiency of the data collection system • Early country results show that the coverage is satisfactory
Launch and release • First launched in early 2011, administrated in 45 sub-Saharan Africa countries • Results from 2011 data collection are first released in May 2012 • Annual data collection, updated in UIS Data Centre and to AU outlook database three times a year
Heat on release In May 2012, the first data collection results were release in UIS and UNESCO web page.
An update on 2012 Africa regional data collection
18 out of 23 countries in Anglophone Africa region have reported data All 23 countries in Francophone Africa region and 4 countries in Arab States have reported data Non response countries How many countries have responded? Seychelles
Africa Regional Module updates Classes and pupils 1 2 12 6 1 1 6 6 Grade 1 Grade 1 Grade 2 12 18 2 3 1 • Key indicators: • Average class size in primary: • Size of single grade classes: • Size of multi-grade classes: • Percentage of students in multi-grade classes: • Average number of grades in multi-grade classes: • Average single grade class size by grade: 18/(3-2+1)=9 (18-12)/(3-2)=6 12/1=12 12/18*100=67% 2/1=2 Grade 1:(12-6)/(2-1)=12 ; Grade 2: n/a Although 14 countries reported data in this table, only 8 of them have publishable indicators on class as information in two columns for multigrade classes are missing.
Africa Regional Module updates How crowded are the classes in Africa primary schools? OECD countries • The average class size ranges from 26 pupils in Cape Verde to 94 in Malawi. • In half of countries reporting data there are more than 50 pupils per class. • In Chad, over 68 pupils per class where nearly 48% of pupils are taught in multi-grade classes. • Central Africa Rep. has substantially large single-grade classes with 99 pupils per class on average. • Eight countries (Botswana, Burundi, Malawi, Mauritius, Rwanda, Swaziland, Tanzania and Uganda) report having no multi-grade classes.
Africa Regional Module updates Which grades are the most crowded? Malawi 130 • In nearly all countries reporting data, most critical early grades are most crowded. • Grade 1 classes in 2/3 countries exceed 50 pupils. Chad 86 Uganda 63 64 Togo 56 55 • In Malawi, Chad, Uganda and Togo, more than 20 additional pupils than in the final grade of primary. • In Mauritius and Namibia, classes at all grades have about 30 pupils. 33 Namibia 30 32 Mauritius Large difference in class sizes over first and last grade tend to be associated with low survival rate to the last grade: Togo Mauritius Malawi Uganda Chad 98 59 53 32 28
Reading and mathematics textbooks • Key indicator: • Pupil/textbook ratio in reading • Pupil/textbook ratio in mathematics • The data reported should only include textbooks owned or kept in schools for instruction use in classroom. • The reading textbooks should include all languages of instruction, e.g. English, French and another local language. • The count of textbooks can include books in stock but not currently in use by pupils. • The count of pupils should not include pupils where information on textbooks is missing.
Most pupils have to share textbooks • About 32% of countries reporting data, there are two or more pupils per reading book. While the availability of mathematics textbooks is even worse in most of these countries. • In Cameroon, only 1 reading book for 11 pupils and only 1 mathematics textbook for 13 pupils. • In Cape Verde and Mauritiushowever, government give new textbooks for free to all grades in primary every year. • In Namibia, only 30% of pupils have textbooks in lower primary grades. In rural village schools, only teachers have textbooks for teaching. Pupil per reading textbook Pupil per mathematics textbook
Newly recruited teachers and new teacher graduates • Key indicators: • Ratio of new graduates from pre-service teacher training programmes: Gt÷Tt*100 • Percentage of newly recruited teachers: Nt÷Tt*100 • Percentage of newly recruited teachers that are trained: • NTt÷Nt*100 • Recruitment rate: Nt÷Tt-1*100 • Attrition rate: (Tt-1+Nt-Tt)÷Tt-1*100 • Attrition is defined as the number of teachers leaving the system or the level due to retirement, transfer to private schools or other levels of education, mortality, migration or other reasons. Gt Nt NTt Table 2.1 Pupils, teachers and institutions by level of education, public institutions Tt
Africa Regional Module updates Do we produce enough or do we hire enough? 21 21 More graduates than newly recruited Less graduates than newly recruited 17 16 15 14 14 12 11 10 10 8 8 8 8 6 5 4 3 2 2 Ratio of new graduates from teacher training programmes Percentage of newly recruited teachers • In Lesotho, newly graduates represent only 2% of teachers currently in service; while in Burundi nearly one graduate for every five active teachers • In Mali, Burkina Faso, Niger, Namibia and Angola, new teacher graduates is far below new teachers recruited. • However, in Cape Verde, Mauritius and Madagascar, newly recruited teachers represents less than half of new graduates. In Burundi, there are only 4 newly recruited teachers from every 7 graduates.
Recruitment rate Recruitment rate compensating for leaving teachers Recruitment rate contributing to expansion of teacher force How much does the teacher force grow? Recruitment rate still needed to compensate for attrition 22 6 18 16 15 15 14 8 13 12 3 9 11 7 10 1 5 9 8 3 1 10 17 10 1 7 4 5 10 10 4 10 1 8 7 7 7 7 7 3 6 1.4 5 4 4 4 4 3 2 2
Recruitment rate Percentage of recruited teachers that are trained How many newly recruited teachers are trained? • In Angola, Malawi and Mali, less than one-half of newly recruited teachers are trained. Angola and Malawi are also among the countries with highest level of teacher attrition. • Niger and Tanzania have relatively moderate levels of attrition, but have succeeded in hiring relatively large proportions of qualified teachers (80% to 90%). 22 18 16 15 15 14 13 12 11 10 10 9 8 8 7 89% 100% 100% 5 100% 45% 80% 4 46% 82% 4 95% 46% 100% 86% 100% 2 100% 100%
Basic services in schools • Toilets can include a pit latrine, an improved pit latrine, a flush toilet, a pour-flush toilet or a composting toilet. • Some countries reporting number of toilets rather than number of schools • Percentage of schools with no information should be minimum.
Africa Regional Module updates Critical shortage of toilets in Africa primary schools Niger Chad 75% 74% 80% Guinea-Bissau 60% 60% Cameroon Ethiopia 54% 58% Côted'Ivoire 66% 51% Togo Equatorial Guinea Congo
Africa Regional Module updates Percentage of primary schools with no electricity Percentage of primary schools with no potable water 100 97 86 97 85 95 95 78 94 77 94 73 92 73 92 70 91 67 90 87 65 85 65 83 63 80 63 75 56 74 50 73 71 49 70 49 68 44 67 43 66 38 65 29 64 51 28 47 18 41 13 33 12 20 9 17 5 4 3 2
School census response rate 79% 100% No available data
More resources: • UIS fact sheets: • “School and teaching resources in sub-Saharan Africa” • http://www.uis.unesco.org/FactSheets/Documents/ib9-regional-education-africa-2012-en-v5.pdf • “The global demand for primary teachers” • http://www.uis.unesco.org/FactSheets/Documents/ib10-2012-teacher-projections.pdf • UIS regional data collection web page: • http://www.uis.unesco.org/Education/Pages/regional-data-collections.aspx The smallest deed done are better than great deeds planned. -- Peter marshall