Clustering and Applications to Biodiversity
150 likes | 355 Vues
Clustering and Applications to Biodiversity. Basic Graph Definitions. Graph : a graph G is a set of vertex (nodes) v connected by edges (links) e . Thus G=(v , e) . Vertex (Node): Element of v Edge (Link): An edge e is a link between two nodes.

Clustering and Applications to Biodiversity
E N D
Presentation Transcript
Clustering and Applications to Biodiversity Presented by: Alassane Ngaide, Frederic Anglade Mentors: Dr. UrmiGhoshDastidar, Dr. Gene Fiorini
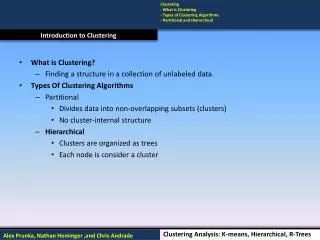
Basic Graph Definitions • Graph: a graph G is a set of vertex (nodes) v connected by edges (links) e. Thus G=(v , e). • Vertex (Node): Element of v • Edge (Link): An edge e is a link between two nodes. • Directed graph or directed graph: consists of vertices and edges with a flow of direction • Undirected graph: consists of a set of vertices and a set of edges with no direction • Cluster: Also called community, it refers to a group of nodes having denser relations with each other than with the rest of the network. A wide range of methods are used to reveal clusters in a network.
FOOD WEB • Food web: A directed graph representing an ecological community with arrow pointing from the preys towards the predators • Each organism in a food web depends for food on one or many other organisms in an ecosystem. • Predators: Eat preys • Preys: Provide energy for predators
Example of Food web Digraph A digraph is a directed Graph. Shark Sea otters Large crab Sea urchins Small fish kelp
COMPETITION GRAPH • Competition Graph: is a graph where the vertices are species in the ecosystem and there is an edge between two vertices if they have a common prey. If vertices are isolated, they either do not have any prey in common with the other species of the ecosystem or they are primary producers • Weighted Competition graph: A graph that associates a weight with every edge in the competition graph. Weight shows the number of shared preys among the associated predators (nodes).
How to Obtain a competition Graph • Food web Diagraph • Weighted Competition Graph 1 1 4 3 2 2 3 5 2 7 1 1 5 6 1 8 7 4 6 8
Laplacian • Given A, the Laplacian matrix L is defined as:
Normalized Laplacian Presented by: Alassane Ngaide, Frederic Anglade
Spectral clustering • Uses information obtained from the eigenvalues and eigenvectors of their adjacency matrices (obtained from the competition graph) for partitioning of graphs • Basic spectral bi-clustering algorithm: • The following algorithm partitions a graph into two clusters, nodes within the same cluster vertices are more connected to each other than with those in the other cluster. Particularly for the competition graph, the competition among species within the same cluster would be higher than with the species those belong to the other cluster. • Input: Weighted Laplacian MatrixFind the eigenvector v corresponding to the second smallest eigenvalue for one of the following problems:Lv = λv (L: Laplacian),L’’v = λv (L’’: Normalized Laplacian).Output: Clusters A = {j;vj>=0} and A’ = {j;vj<0}.
Fiedler order is believed to provide the best linear search order for finding the optimum cut. However, it is possible to have nodes sharing higher linkage to the other cluster than the one they are currently assigned to by using only the information of Fiedler order. • It is observed that a linkage differential order provides a better ordination than the Fiedler order (still to explore). • Plan to implement a combination of Fiedler order with linkage differential order for analyzing competition graph Presented by: Alassane Ngaide, Frederic Anglade
Problem Given the competition graph G = (V,E) (based on Hudson River data sets) with the node set (species) V, edge set E, and the weight matrix W (Wij = number of shared preys between ith and jth predators), is it possible to partition the competition graph G into two subgraphs GA and GB using a combination of Fiedler order and linkage-based refinements to minimize cut(A,B) while maximizing W(A) and W(B) at the same time? The strength between two nodes (species) is given by their edge weight (Wij) and the strength between two clusters A and B is given by
Reference:“Food Webs, Competition Graphs, and Habitat Formation” Margaret B. Cozzens, DIMACS, Rutgers UniversityNir Ailon, Moses Charikar, Alantha Newman.(2008). Aggregating inconsistent information: Ranking and clustering. J. ACM 55(5)Ding. C. HQ et al..(2001). A Min-max Cut Algorithm for Graph partition and clustering. IEEE conference Proceeding. pp . 107-114Chung, F. R. K. (1997). Spectral graph theory. Providence, RI: American MathematicalSociety.Dy, J. G., & Brodley, C. E. (2004). Feature selection for unsupervised learning.J. Mach. Learn. Res., 5, 845–889.Hagen, L., & Kahng, A. (1992). New spectral methods for radio cut partitioningand clustering. IEEE Transactions on Computer-Aided Design, II(9), 1074–1085.
Problem • Given the competition graph G= (V, E) based on the Hudson river data sets with the node set (species) V, edge set E, and the weightmatrix W (Wij = number of shared preys between ith and jth predators), it is possible to partition the competition graph G into two sub graphs GA and GB using the combination of Fiedler order and linkage-based refinements to minimize cut (A, B) while maximizing WA and WB at the same time • The strength between two nodes (species) is given by the edge weigh (Wij) and the strength between two clusters is given by: cut (A,B) =W(A,B) where:W(A,B) = ∑Wij, iЄ A, jЄ B WA = W(A,A) • Both these requirements can be satisfied by the objective function: Mcut = cut(A,B)/WA + cut(A,B)/WB The above is called the min-max cut function. It minimizes the cut between two clusters while maximizing the connection within the cluster