Download
1 / 86
860 likes | 979 Vues
American Cancer Society Study 900,000 adults Calle et al., NEJM, 348:1625-1638, 2003. Overall Relative Cancer Risk (BMI >40 vs 18.5 to 24.9): M: 1.52 (1.13 – 2.05): F: 1.62 (1.40 – 1.87)

E N D
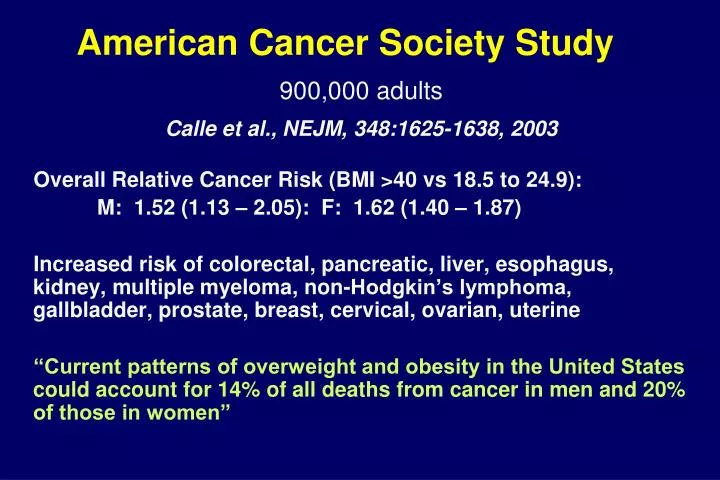
American Cancer Society Study • 900,000 adults • Calle et al., NEJM, 348:1625-1638, 2003 Overall Relative Cancer Risk (BMI >40 vs 18.5 to 24.9): M: 1.52 (1.13 – 2.05): F: 1.62 (1.40 – 1.87) Increased risk of colorectal, pancreatic, liver, esophagus, kidney, multiple myeloma, non-Hodgkin’s lymphoma, gallbladder, prostate, breast, cervical, ovarian, uterine “Current patterns of overweight and obesity in the United States could account for 14% of all deaths from cancer in men and 20% of those in women”
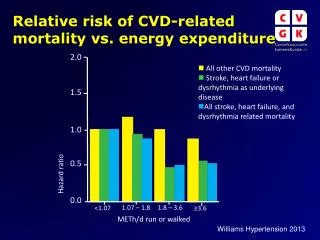
Guidelines for Healthy Weight Nurses’ Health Study: Willett et al., NEJM, 341:427-434, 1999 BMI of 26 vs 21 Coronary Heart Disease: 2x increase Hypertension: 2-3x increase Type II Diabetes: 8x increase Weight Change of 15 kg Coronary Heart Disease: 2x increase Hypertension: 2-3x increase Type II Diabetes: 6x increase
Caloric Restriction (CR) CR is an experimental paradigm in which the dietary/caloric intake of a group of animals is reduced relative to that eaten by ad libitum fed controls
Caloric restriction is the most potent, most robust, and most reproducible known means of reducing morbidity and mortality in mammals
Survival Data, 1987 Cohort, Casein Diet 100 80 AL DR 60 Survival Rate 40 20 0 0 200 400 600 800 1000 1200 1400 Days
DR Reduces Morbidity:Breast Cancer • Delays tumor onset (initiation and promotion) • Slows progression • Can modulate oncogene penetrance • v-Ha-ras tumors decreased 67% • (Fernandes et al., PNAS 92:6494-6498, 1995) • Can prevent carcinogen-induced tumors • 7,12-demethyl-benz(a)anthracene (60% AL, 0% DR) • Kritchevsky et al. Cancer Res 44, 3174-3177, 1984 • Even with high fat diet, tumor yield, size, burden down 93-98% • Klurfied et al. Cancer Res 47, 2759-2762, 1987
CR “Beneficial” Effects • Lower oxidative stress • “Better” redox balance • “Improved” glucose metabolism • Increased insulin sensitivity • Reduced blood glucose • Reduced diabetes risk • Reduced inflammation
How do we study complex biological/clinical problems?How do we address such questions in humans, where our ability to manipulate and analyze the system is limited?
High Throughputand/or Data Density Studies • Genomics/SNPs • mRNA expression arrays • Proteomics • Small metabolites
Metabolomics: The –omics face of biochemistry Measurement of changes in populations of low molecular weight metabolites under a given set of conditions Fiehn
HEALTH GENOME STATE PROTEOME TRANSCRIPTOME ENVIRONMENT DISEASE METABOLOME STATE
HEALTH GENOME STATE PROTEOME TRANSCRIPTOME ENVIRONMENT DISEASE METABOLOME STATE
Sample Analysis Sample Collection AL8 AL7 AL5 AL1 3 SD AL4 AL3 2 SD AL2 AL6 DR8 DR6 DR5 DR7 DR1 2 SD DR4 DR2 DR3 1.0 0.8 0.6 0.4 0.2 0.0 Database Curation 0.80 0.60 Response (µA) 0.40 0.20 0.00 1 0.0 20.0 40.0 60.0 80.0 100.0 Retention time (minutes) Computational Modeling of Metabolic Serotypes Objectively Defining Class Identity Observed Values vs. Predicted Values Mechanistic Insight Drug Development Toxicology Classification Prediction Functional genomics Sub-threshold studies Others Actual Predicted Modeling Metabolic Interactions Following Biochemical Pathways Bioinformatics
What we measure -- biochemically Metabolites – small molecules Pathways (eg, purine catabolites) Interactive pathways (eg, amino acid metabolism) Compound classes (eg, lipids) Conceptually linked systems eg antioxidants, redox damage products
What we measure -- conceptually Biochemical constituents Excretion products Precursor – product Balances (eg, redox systems) “collection depots” Flux Snapshot view of biochemistry Integrated signal from genome and environment Short and long term status Temporal image Sub-threshold changes (eg (toxicology, nutrition)
Metabolomics – Some Advantages Sensitivity “silent phenotypes”/sub-threshold effects Discovery Knowledge base (ie, metabolic pathways) Limited repertoire – simplifies possibilities (2500 non-lipid endogenous metabolites??) Metabolome integrates signal Nature and Nurture -- genome and environment Measurement of system status/defects Metabolome has the fastest response time
Metabolomics – Some Disadvantages Too Sensitive? cohort effects, site effects, time effects sample handling individual metabolites responsive to multiple factors genes, environment, health status, location experiment design must account for all factors controlled or fuzzy, multiple sources Practical Set-up costs Possible need for multiple platforms (NMR, MS, HPLC) early industry dominance – lots of propriety data incompatible data standards
Metabolomics Technology = MetabolomicsPlatform
Biology AnalyticalChemistry Data Analysis
Sample Analysis Sample Collection Database Curation 0.80 0.60 Response (µA) 0.40 0.20 0.00 1 0.0 20.0 40.0 60.0 80.0 100.0 Retention time (minutes) Computational Modeling of Metabolic Serotypes Objectively Defining Class Identity Observed Values vs. Predicted Values AL8 AL7 AL5 AL1 3 SD AL4 AL3 2 SD AL2 AL6 Mechanistic Insight Drug Development Toxicology Classification Prediction Functional genomics Sub-threshold studies Others DR8 Actual DR6 DR5 DR7 DR1 2 SD DR4 DR2 DR3 Predicted 1.0 0.8 0.6 0.4 0.2 0.0 Modeling Metabolic Interactions Following Biochemical Pathways Bioinformatics Analytical
Sample Analysis Sample Collection Database Curation 0.80 0.60 Response (µA) 0.40 0.20 0.00 1 0.0 20.0 40.0 60.0 80.0 100.0 Retention time (minutes) Computational Modeling of Metabolic Serotypes Objectively Defining Class Identity Observed Values vs. Predicted Values AL8 AL7 AL5 AL1 3 SD AL4 AL3 2 SD AL2 AL6 Mechanistic Insight Drug Development Toxicology Classification Prediction Functional genomics Sub-threshold studies Others DR8 Actual DR6 DR5 DR7 DR1 2 SD DR4 DR2 DR3 Predicted 1.0 0.8 0.6 0.4 0.2 0.0 Modeling Metabolic Interactions Following Biochemical Pathways Bioinformatics Data Analysis
Sample Analysis Sample Collection Database Curation 0.80 0.60 Response (µA) 0.40 0.20 0.00 1 0.0 20.0 40.0 60.0 80.0 100.0 Retention time (minutes) Computational Modeling of Metabolic Serotypes Objectively Defining Class Identity Observed Values vs. Predicted Values AL8 AL7 AL5 AL1 3 SD AL4 AL3 2 SD AL2 AL6 Mechanistic Insight Drug Development Toxicology Classification Prediction Functional genomics Sub-threshold studies Others DR8 Actual DR6 DR5 DR7 DR1 2 SD DR4 DR2 DR3 Predicted 1.0 0.8 0.6 0.4 0.2 0.0 Modeling Metabolic Interactions Following Biochemical Pathways Bioinformatics Biology
Survival Data, 1987 Cohort, Casein Diet 100 80 AL DR 60 Survival Rate 40 20 0 0 200 400 600 800 1000 1200 1400 Days
Hypothesis: Long-term, low-calorie diets induce changes in metabolism that persist throughout the lifespan
Predictions • CR alters the sera “metabolome” • There exists a “CR Serotype” • …Part of “CR serotype” reflects beneficial physiological status --- ie, serotype defines health without reference to disease…
Goals Insights into the mechanism of CR Recognize CR in other organisms (e.g., non-human primates) 3) Biochemically determine the effective, long-term caloric intake of an individual (e.g., for epidemiological studies) Identify predictive markers of disease (e.g., to intervene/prevent/focus resources; focus on diseases where intervention is possible)
Experimental Design Model: F344 x BN F1 Rat Overall Design: AL/CR, male/female, 5 different ages Different extents and duration of diets Total experiment ~36 groups, 82 cohorts. Approach: HPLC separations with coulometric array detection (LC/LC-MS for plasma proteomics) Multilayer statistical and data analysis
Analytical Stability Biologic Variability
Analytical vs Biological Variation In Rats: Biological variability 5 fold greater than analytical variability Analytical variability does not influence biological variability
Primary Data Analysis • Multivariate analyses are relatively noise-resistant • Minimize loss of informative metabolites • Reduce false negatives (Type II errors) • Increase false positives (Type I errors)
Does Serotype Encode Sufficient Information to Identify Diet Group?
Data Exploration and Classification Analysis • Hierarchical Cluster Analysis (HCA) • Identifies natural groups in data • Principal Component Analysis (PCA) • Finds linear combinations of original variables that account for maximal variation
Model Feature Selection T-tests, p<0.2 ?! HCA Proof of Principle PCA
HCA Validation PCA HCA Simplify Model PCA
Status Proof of principle accuracy: HCA (100%) PCA (100%) Validation Accuracy: HCA (94%) PCA (100%) - subjective rotation Simplification – HCA (Fails) PCA (100% Accuracy) Use larger models? Test components vs distance
“Expert Systems/Supervised Analysis” KNN • k-nearest neighbor analysis • Supervised HCA (HCA is KNN with K=1) • Distance-based metric • Strength is with small (training) datasets SIMCA • Soft Independent Modeling of Class Analogy • Supervised PCA • Component-based metric • Strength is modeling flexibility (eg, group-specific interactions)
In our DR sera metabolomics data – components greatly outperform distance-based algorithms
In OUR DR SERA METABOLOMICS data – components greatly outperform distance-based algorithms
Profiles are cohort specific
Cohort Separations male samples modeled with male/female data set AMAL 4 AMDR BMAL 2 BMDR 0 CMAL t[3] -2 CMDR 6 4 -4 2 0 -6 -2 8 t[1] 6 -4 4 2 -6 0 -2 -8 -4 t[2]
Cohort Effects PLS-DA p<0.001
Markers “Predict” Caloric Intake with High Quantitative Accuracy -- Proof of Concept --
Iteratively improve models – focus on analytical robustness Then test one model…