Download
1 / 1
10 likes | 93 Vues
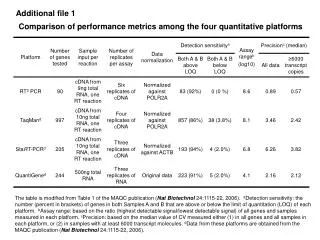
This table outlines detection sensitivity, assay range, precision, and data sources from four quantitative platforms. Data is modified from a publication in Nature Biotechnology 2006.

E N D
Additional file 1 Comparison of performance metrics among the four quantitative platforms The table is modified from Table 1 of the MAQC publication (Nat Biotechnol 24:1115-22, 2006). aDetection sensitivity: the number (percent in brackets) of genes in both Samples A and B that are above or below the limit of quantitation (LOQ) of each platform. bAssay range: based on the ratio (highest detectable signal/lowest detectable signal) of all genes and samples measured in each platform. cPrecision: based on the median value of CV measured either (1) in all genes and all samples in each platform, or (2) in samples with at least 6000 transcript molecules. dData from these platforms are obtained from the MAQC publication (Nat Biotechnol 24:1115-22, 2006).