Debugging Scenarios
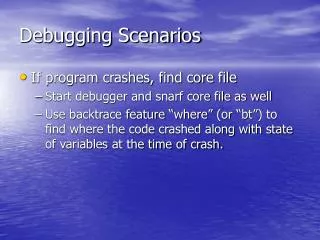
Debugging Scenarios. If program crashes, find core file Start debugger and snarf core file as well Use backtrace feature “where” (or “bt”) to find where the code crashed along with state of variables at the time of crash. Good Programming Practice.

Debugging Scenarios
E N D
Presentation Transcript
Debugging Scenarios • If program crashes, find core file • Start debugger and snarf core file as well • Use backtrace feature “where” (or “bt”) to find where the code crashed along with state of variables at the time of crash.
Good Programming Practice • Run valgrind especially for those programs which dynamically allocate memory whether or not it’s crashing. • /usr/shared/bin/valgrind • Web Page: http://valgrind.kde.org % valgrind [vgoptions] your_program [prgm args]
Valgrind Features • No need to modify, recompile or relink • Can debug large programs • Usable on almost any kind of software written in any language • Works on entire program, including proprietary libraries • Works with GDB • Actively maintained % valgrind [vgoptions] your_program [prgm args]
Valgrind Features • Use of unintialized memory • Read/Write of freed memory • ABR/ABW of malloc’d or new blocks • Inappropriate stack writes • Memory leaks • Mismatched use of malloc/new v.s. free/delete
What valgrind can’t do (Sob!) • Cannot detect ABW/ABR of static or stack arrays. From FAQ: int static[5]; int main(void) { int stack[5]; static[5] = 0; stack [5] = 0; return 0; } Unfortunately, [it] doesn't do bounds checking on static or stack arrays. We'd like to, but it's just not possible to do in a reasonable way that fits with how [it] works. Sorry.
Valgrind • Open source and actively maintained • Other developers have provided “add-ons” • Helgrind – detects data races in C & C++ that use pthreads • Massif – a profiler providing heap and stack information on running programs
Final Case . . . EVENT: office_id = LWX EVENT: num_rows = 7 Hsql_query = select * from rpt where (wmo_dd not like 'SAUS4%' or (wmo_dd like 'SAUS4%' and (report like '%METAR%' or report like '%SPECI%') and report like '%RMK%')) and icao_loc_id IN ('KBWI', 'KCON', 'KIAD', 'KITR', 'KMOT', 'KPWM', 'KSLC') and (date_trunc('hour', origin) = date_trunc('hour', timestamp '2005-01-12 14:00:00') - interval '1 hour') ORDER by icao_loc_id ASC, date ASC, origin DESC Printing rows = 146 ==17183== ==17183== Invalid write of size 4 ==17183== at 0x8071EF0: get_report (db_report.ecpp:967) ==17183== by 0x69676972: ??? ==17183== Address 0x2772756F is not stack'd, malloc'd or free'd Segmentation fault (core dumped) • Valgrind provides a clue . . . .
Final case . . . • The offending line looks innocuous . . .an assignment • What’s going on? Let’s look again at valgrind’s output. { *hm_data = first_data; }
Final case . . . ==17183== Invalid write of size 4 ==17183== at 0x8071EF0: get_report (db_report.ecpp:967) ==17183== by 0x69676972: ??? ==17183== Address 0x2772756F is not stack'd, malloc'd or free'd • The last two lines provided important clues. To understand what is meant by them, a brief digression.
Brief Digression • Now lets go back and look at valgrind’s output again
Final Case. . . • Originally these variables referred to sane addresses in the heap area, but “something” happened, not at the line where the crash happened, but earlier. • Using DDD and watching the address of the affected variable, an ABW of a completely unrelated stack array was found. This clobbered pointer values. If you dereference invalid addresses -> SEGV.
When stumped? • Try to use all available clues offered. • Get another set of eyes to look at the problem. • Explaining the problem to someone else helps.
Questions/Comments? • This presentation will be archived on the Quality Assurance web page under the “Training” link on the LHS. http://www.mdl.nws.noaa.gov/qa Cece is on next week! Her presentation will be on Tk/Tcl programming.