Download
1 / 15
150 likes | 264 Vues
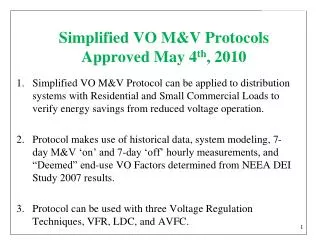
The Simplified Voltage Optimization Measurement and Verification (M&V) Protocol, approved on May 4, 2010, is designed for use in residential and small commercial distribution systems to assess energy savings achieved through reduced voltage operations. This protocol utilizes historical data, system modeling, and a combination of 7-day measurements when systems are 'on' and 'off', leveraging "Deemed" end-use voltage optimization factors derived from the NEEA DEI Study (2007). It incorporates three voltage regulation techniques: Voltage Fixed Reduction (VFR), Line Drop Compensation (LDC), and Automatic Voltage Feedback Control (AVFC).

E N D
Simplified VO M&V ProtocolsApproved May 4th, 2010 • Simplified VO M&V Protocol can be applied to distribution systems with Residential and Small Commercial Loads to verify energy savings from reduced voltage operation. • Protocol makes use of historical data, system modeling, 7-day M&V ‘on’ and 7-day ‘off’ hourly measurements, and “Deemed” end-use VO Factors determined from NEEA DEI Study 2007 results. • Protocol can be used with three Voltage Regulation Techniques, VFR, LDC, and AVFC. 1
Volts 126 120 114 Feeder Length Three Voltage Regulation Techniques Existing Vset = 125V New Vset = 122V • Voltage Fixed Reduction (VFR) • Fixes the voltage level at the substation source and the voltage level at the end of the feeder varies with load • Old voltage setting Vset = 125V, R and X settings = 0 • New voltage setting Vset = 122V, R and X settings = 0 2
Volts 126 120 114 Feeder Length Three Voltage Regulation Techniques Existing Vset = 125V New Vset = 120V, R and X setting = 3 to 5 • Line Drop Compensation (LDC) • Fixes the voltage level at the end of the feeder and the voltage level varies at the substation source with load • Old voltage setting Vset = 125V, R and X settings = 0 • New voltage setting Vset = 120V, R and X settings = 3 to 5 3
Three Voltage Regulation Techniques • Automatic Voltage Feedback Control (AVFC) • Fixes the voltage level at the substation source based on real-time voltage feedback sign from the end of the feeder (s) 4
Volts 126 120 114 Feeder Length Three Voltage Regulation Techniques Existing Vset = 125V • Automatic Voltage Feedback Control (AVFC) • Fixes the voltage level at the substation source based on real-time voltage feedback sign from the end of the feeder • Old voltage setting Vset = 125V, R and X settings = 0 • New voltage setting Vset = 119V, R and X settings = 0 Vset = Adjusts for load conditions based on end of line feedback 5
Primary Voltage Zone Secondary Voltage Zone VCZ for LTC Transformer Feeder Load Tap Changer (LTC) Feeder Breaker Voltage Control Zones
VCZ for LTC VCZ for V-Reg Transformer Feeder V-Reg Load Tap Changer (LTC) Feeder Breaker Voltage Control Zones
Four Stages to Simplified VO M&V Protocol Historical Load Data: kWh-annual, Volt_Drop-max, kWpeak-demand Distr _Line Modeling Load_Flow Analysis Threshold Analysis Determine end-use VO Factor Estimate Potential Savings Install VO and SI Improvements 1. 2. 3. 4. Existing Performance Assessment and VO Implementation Plan System Improvements Baseline Pre-VO measurements 7-day measurements ‘OFF’ Veol, Vset, Esub Calculate Vpre-annual average VO Implementation Post-VO Measurements and Verification 7-day measurements ‘ON’ Veol, Vset, Esub Calculate Vpost-annual average Determine Verified Savings Persistence Measurements
Performance Thresholds • Power Factor • Power Factor on average > 98% (period) • Power Factor minimum > 96% (period) • Phase Unbalance • Must be < 0.15pu, or < 40 amps • Voltage Drop (Vd) for each voltage control zone • Must be < 3.3% on primary at feeder peak loads 9
Performance Thresholds (continued) • Maximum Voltage Drop Variance (Vdv) between feeders within the same voltage control zone (during period) • Must be < 0.25 p.u. or < 2.0V • Maximum Voltage Drop (Vd) for secondary • Must be < 4.0%, based on design standards and criteria • Voltage level must be > (114V+1/2 Bandwidth) and less than (126V-1/2 Bandwidth) 10
Why Performance Threshold are Critical Establishing thresholds helps to resolve key issue found in the pilot NEEA projects that did not perform well. • Reduces voltage fluctuation due to changing loads/conditions • Reduces losses in the distribution system • Allows recording periods to be minimized (1 week to establish daily load shapes and weekend/weekday load shapes) 11
395 VO Factor Determination • Uses Results from the NEEA DEI study to determine • Heating and cooling zones • Residential and commercial load • End-use load characteristics • Electric heating • Air conditioning 12
NEEA DEI Study VOf SensitivityMinor impacts due to AC End-Use Load 16% Variation
Voltage Reduction Calculation • Calculate ΔV for each voltage control zone • Dependant on which voltage control method • VFR Adjusted Average Voltage for VFR = [Regulator_Set_Point_Voltage_Setting – ½ * A * Annual_Load_Factor] • LDC/AVFC Adjusted Average Voltage for LDC = [Regulator_Set_Point_Voltage_Setting + Annual_Load_Factor *[B - 1/2 *A]] Where: A is the maximum voltage drop at peak load, and B is the Calculated Regulator Maximum Annual Volt-Rise 14
From NEEA’s DEI research and pilot VO calculation method already “approved” by RTF From proposed protocols Method of Calculating Energy Savings (Delta V) 15 Energy Saved = Change in voltage x Voltage Optimization Factor x Annual Energy + Energy Saved from System Improvements ESaved = ΔV x VOf x EAnnual +ΔESI • ΔV - determined from this program • VOf -derived from NEEA load research study and confirmed by EPRI studies, and other industry pilots and research • E Annual – Metered Data from Utility • ΔE - Energy Saved from System Improvements