QUASAR EVOLUTION
QUASAR EVOLUTION. Deborah Dultzin-Hacyan Instituto De Astronomia (UNAM) México Paola Marziani Instituto Nacionale di Astrofisica, Osservatorio Astronomico di Padova, Italy Jack W. Sulentic University of Alabama, USA Alenka Negrete Instituto de Astronomia (UNAM) México.

QUASAR EVOLUTION
E N D
Presentation Transcript
QUASAR EVOLUTION Deborah Dultzin-Hacyan Instituto De Astronomia (UNAM) México Paola MarzianiInstituto Nacionale di Astrofisica, Osservatorio Astronomico di Padova, Italy Jack W. SulenticUniversity of Alabama, USA Alenka Negrete Instituto de Astronomia (UNAM) México
RESULTS FROM REVERBERATION MAPPING OF NGC5548 (Korista et. al. 1995) HST and GROUND MONITORING OF BROAD LINE RESPONSE TO UV CONTINUUM VARIATIONS HIGH IONIZATION LINES RESPOND WITHIN 2 LIGHT DAYS (0.0065 Pc) LOW IONIZATION LINES RESPOND WITHIN 20 LIGHT DAYS (0.065 Pc) NARROW LINE REGION IS RESOLVED BY HST 0.3-30 Pc BY NOW MORE THAN 30 SEYFERTS HAVE BEEN STUDIED THIS WAY (Peterson et. al. 2004; Kaspi et. al. 2005; Collin et al. 2006) BLR WILL NOT BE SPATIALY RESOLVED IN THE FORSEEABLE FUTURE
Averange Quasar Spectrum: Francis et al. 1991 Eigenvectors of Quasars Quasar spectra are not similar! Historic inability to explain line ratios via simple photoionization models
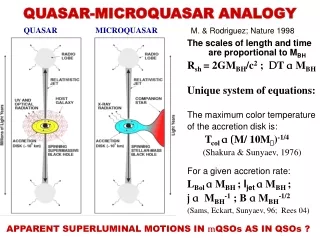
EIGENVECTOR 1 PARAMETER SPACE FWHM H velocity dispersion of LIL EW (FeII Optical) / EW (Broad H) (RFeII) ratio of LIL with opposite density dependences Soft X-ray Photon Index (soft) thermal emission signature CIV 1549 Broad Line Shift systematic motions of HIL Precursors: Boroson & Green (1992); Boller et al. (1996); Marziani et al. (1996); Wang et al. (1996);Laor et al. (1997)
Population A: FWHM Hβ < 4000Kms-1Population A: FWHM Hβ > 4000Kms-1
B FWHM H FWHM H 4000 km/s A RFeII
CIV no systematic shift (high EW) systematic blueshift (low EW) RFeII FWHM H
Black Hole Masses H profile is dominated by gravity. Emitting gas is virialized (much observational evidence and Susy Collin’s talk this afternoon) H not available in optical spectra for quasars with z>1 Some authors have restored to using CIV profiles for quasars with z>1 instead (e.g.Vestergaard 2002; 2004; Dietrich & Hamann 2004) But there is evidence that CIV emitting gas can be dominated by radiation pressure (e.g. Baskin & Laor 2005) at least forpop A quasars (Bachev et al . 2004; Marziani et al. in preparation) We have observed 50 quasars in the range 0<z<2.5 with IR spectrometer ISAAC on VLT (25 published in Sulentic et al. 2004; 2006). S/N ~30 in continuum
CAVEATS and SOURCES OF ERRORS see detailed discussion in Sulentic et al. 2006 Astro-ph/0606309 • 1. Use of single epoch and/or low S/N spectra • 2. Strongly asymmetric profiles can produce uncertainties of up to 40% in Black Hole Masses estimated from FWHM H (Marziani et al. 2003), even with high S/N spectra. e.g., no correction for VBLR red asymmetric, optically thin (not reverberating) component of broad H (in pop B). • 3. Lack of proper subtraction or contamination of FeII, HeI, broad [OIII] 4959/5007 and even H NC • Orientation effects (Collin et al. 2006 Astro-ph/0603460) and her talk this afternoon
We present results from nearly 300 high S/N (~30 in continuum) optical spectra from San Pedro Matir, Mexico and 25 IR spectra from ISAAC on VLT1 (Antu) • Each spectrum covers the region of redshifted H and FeIIλ4570 or FeIIλ5130 • Ho=70 Kms-1Mpc-1, ΩM=0.3, ΩΛ=0.7, k correction computed for α=0.6 (S ~υα)
Let’s try FWHM FeII (also virialized: Zhang, Dultzin-Hacyan & Wang MNRAS 2006 Astro-ph/0607566)
Correcting face-on NLSy1’s for orientation
CONCLUSIONS • There seems to be a limit to BH massevolution with z. MBH<1010M for masses determined from Balmer and FeII emitting gas at low and intermediate redshifts This is reasonable because, if the dispersion velocity - bulge mass - BH mass relation holds for intermediate and high z, higher BH masses would imply bulge velocity dispersions ≥700 Kms-1 and bulge masses ≥1013 M
At Joint Discussion 07 “the Universe at z≥6” J.D. Kurk reported on recent ISAAC/VLT IR spectorscopy of 6 (?) 7 quasars with z≥5 BH masses determined from MgII lines (also assumed to be emitted from virialized gas) are also <1010 which CONFIRMS THIS RESULT
conclusions E1 four dimentional diagram may provide a surrogate to H-R diagram for AGN withL/LEDD and MBH as physical underlying parameters. Pop A objects show systematically higher L/LEDD and lower MBH than pop B objects (including most radio loud objects)