Download
1 / 32
320 likes | 529 Vues
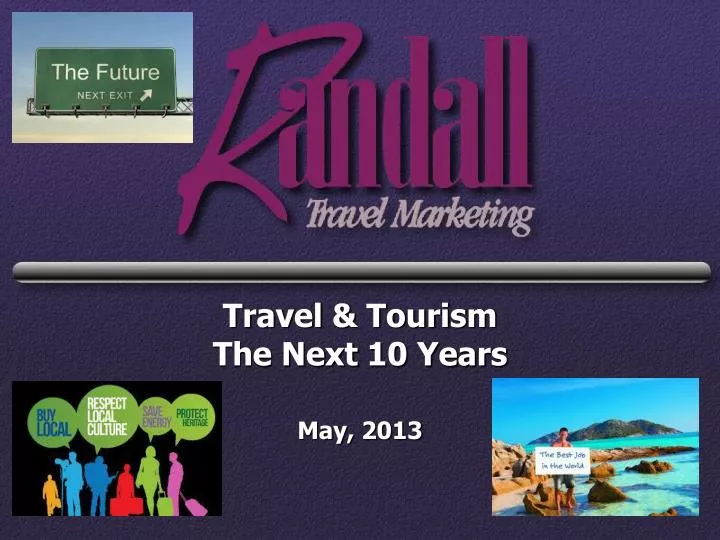
Travel & Tourism The Next 10 Years May, 2013. The Future. “The travel industry is good for the earth, the children and the future. It constitutes 3-10% of GDP in advanced economies and up to 40% in developing countries.” Bill Clinton April 10, 2013 World Travel & Tourism Council Summit

E N D
The Future “The travel industry is good for the earth, the children and the future. It constitutes 3-10% of GDP in advanced economies and up to 40% in developing countries.” Bill Clinton April 10, 2013 World Travel & Tourism Council Summit Abu Dhabi
State of Tourism • 2012: Worldwide 1 Billion people traveled outside their national borders • One in 12 U.S. jobs related to tourism, US $6.3 trillion, 9% of global GDP • World’s largest service sector industry – strong industry sectors (lodging, transportation, etc.) - but lacking a unified “voice” • In U.S. elected leaders are paying more attention • Most states in U.S. are engaged in promotion • Numerous local (county/city) DMOs in U.S. • Devoted customers – travel is now mainstream and diverse (business, sports, leisure, meetings, etc.)
Destination Weakness • Aging infrastructure (hotels, attractions) • Poor knowledge of visitor behavior & perceptions • Homogeneous (Everywhere USA) • Wayfinding & Signage • Orientation & Facilitation: How to (fish, kayak, bike, etc.) • Lack of community support • Difficult to “find the good stuff”
The Future of Tourism Amazing Opportunities & Challenges HUGE changes coming • Demographics • Technology • Moderate Growth
Next 10 Years in Tourism • Age of the Informed Consumer (peer info) • Age of Intelligent Growth (3-5%/yr)
New Technologies Trend: Moving from pre-planning to real time • Mobile, social, on-line, etc. • New social apps (Kik=50mil users; whatsapp=1Billion messages/day, etc. – text without paying) • Hybrid Meetings & Gatherings • Info & services target you at your location • Instant Concierge • The new luxury traveler (young, sophisticated, spoiled, demanding)
Travel Industry Sectors • Airlines & Transportation • Lodging • Hotels/motels • Rentals • B&B • Camping/RV • Retail • Attractions • Dining • Cruises • Packaged Travel • Motorcoach
Major Future Issues • Ageing population & new generational priorities • Increasingly connected society (mobile) • Fluctuating economic conditions worldwide • Consumer appetite for travel is insatiable • Time compression (time poverty) • Convenience wins • Changing customer: Makes their own decisions, is more connected that ever, shapes their own relationship with brands. - Keynote address: David Scowsill April 2013 World Travel and Tourism Council’s Global Summit
Typical Consumer Spending • 33% Housing (mortgage, property taxes, repairs, etc.) • 17% Transportation (car payments, insurance, etc.) • 13% Food • 10% Entertainment (alcohol, going out, movies, travel, etc.) • 9% Pensions & Savings (Social Security, investments, insurance, etc.) • 6% Healthcare • 5% Clothing • 3% Personal Care (hair, health & beauty, etc.) • 2% Charitable Giving • 2% Education 100%
Consumer Trends • Trust (brand transparency) • Get real (authenticity – nobody’s perfect) • Return to your senses (see, touch, hear) • Every purchase is an investment • Mobile • Buy local
Current Literature Says • Aging population • Increase in physical challenges (10% of population now) • Growth in diversity • Homogenization of America & World vs. Culture Diversity • Technology explosion • Trading Up – Higher expectations for quality • Time poverty • Visit places where history happened vs. History Channel on TV • Shared experienced with family & friends • Safety, comfort, convenience
Trend Results • The customer has changed • The product has not kept pace • Product life cycle issues • Too many choices • Stressed out, just want to relax • Unwillingness to accept poor quality • Demand for more engaging interpretation • Difficulty in choosing & planning a trip
The three regions the country is dividing itself into are The New Sunbelt, The Melting Pot, and The Heartland New Sunbelt Melting Pot Source: William H. Frey, Brookings Institute Heartland States
2012 United Van Lines Moving In: • District of Columbia • Oregon • Nevada • North Carolina • South Carolina Moving Out: • New Jersey • Illinois • West Virginia • New York • New Mexico
Population Growth Estimates: Northeast State 2000 2030 +/- Maine 1,274,923 1,414,402 136,174 (10%) New Hampshire 1,235,786 1,646,471 410,685 (33%) Vermont 608,827 711,867 103,040 (17%) Massachusetts 6,349,097 7,012,009 662,912 (10%) Rhode Island 1,048,319 1,152,941 104,622 (10%) Connecticut 3,405,565 6,688,630 283,065 (8%) New York 18,976,457 19,477,429 500,972 (3%) Pennsylvania 12,281,054 12,768,184 487,130 (4%)
Population Growth Estimates: Mid-Atlantic State 2000 2030 +/- New Jersey 8,414,350 9,802,440 1,388,090 (16%) Delaware 783,600 1,012,658 229,058 (29%) Maryland 5,296,486 7,022,251 1,725,765 (33%) District of Columbia 572,059 433,414 -138,645 (-24%)
Population Growth Estimates: South State 2000 2030 +/- Alabama 4,447,100 4,874,243 427,143 (10%) Florida 15,982,378 28,685,769 2,703,391 (79%) Georgia 8,186,453 12,364,879 4 ,178,426 (51%) Kentucky 4,041,769 4,937,660 895,891 (22%) Louisiana 4,468,976 4,802,633 33,657 (7%) Mississippi 2,844,658 3,092,410 47,752 (9 %) N. Carolina 8,049,313 11,880,698 3,831,385 (48%) S. Carolina 4,012,012 5,148,569 1,126,557 (28%) Tennessee 5,689,283 7,380,634 1,691,351 (30%) Virginia 7,078,515 9,825,019 2,746,504 (39%) West Virginia 1,808,344 1,719,959 - 88,385 (-5%)
Population Growth Estimates: Midwest State 2000 2030 +/- Ohio 11,353,140 11,550,528 197,388 (2%) Indiana 6,080,485 6,810,108 729,623 (12%) Illinois 12,419,293 13,432,892 1,013,599 (8%) Michigan 9,938,444 10,694,172 755,728 (8%) Wisconsin 5,363,675 6,150,764 787,089 (15%) Minnesota 4,919,479 6,306,130 1,386,651 (28%) Iowa 2,926,324 2,955,172 28,848 (1%) Missouri 5,595,211 6,430,173 834,962 (15%) North Dakota 642,200 606,566 -35,634 (-6%) South Dakota 754,844 800,845 45,618 (6%) Nebraska 1,711,263 1,820,247 108,984 (6%) Kansas 2,688,418 2,940,084 251,666 (9%)
Population Growth Estimates: West South Central State 2000 2030 +/- Arkansas 2,673,400 3,240,208 566,808 (21%) Oklahoma 3,450,654 3,913,251 462,597 (13%) Texas 20,851,820 33,317,744 12,465,924 (60%)
Population Growth Estimates: West State 2000 2030 +/- Montana 902,195 1,044,898 142,703 (16%) Idaho 1,293,953 1,969,624 675,671 (52%) Wyoming 493,782 522,979 29,197 (6%) Colorado 4,301,261 5,792,803 1,491,096 (35%) New Mexico 1,819,046 2,099,708 280,662 (15%) Arizona 5,130,632 10,712,397 5,581,765 (109%) Utah 2,233,169 3,485,367 1,252,198 (56%) Nevada 1,998,257 4,282,102 2,283,845 (114%)
Population Growth Estimates: Pacific State 2000 2030 +/- Washington 5,894,121 8,624,801 2,730,680 (46%) Oregon 3,421,399 4,833,918 1,412,519 (41%) California 33,871,648 46,444,861 12,573,213 (37%) Alaska 626,932 867,674 240,742 (38%) Hawaii 1,211,537 1,466,046 254,509 (21%)
What will change in Pennsylvania? • Tourism • Economy • Population • Politics • Health care • Real estate • City/County/State taxes • Roads & infrastructure • Education • Technology • Shopping
What will change? • “Warm and Friendly” – will it last? • Food: More exotic – less authentic regional flavor • Scenic beauty vs. traffic • Wildlife vs. “Flattened Fauna” • Year-round travel • Loss of space: fishing, biking, birding, etc. • Quality of interpretation • Preservation of “sense of place” • Homogenization
20 Year Vision • Solid, business method approach to travel & tourism • Good sales & marketing team • Growth – focus on manageable and profitable! • Provide orientation & facilitation • Invest in modern infrastructure (Monitor status) • Excellence in tracking & measuring market segments • Time to cash in!!!
Judy Recommends • Know your current visitor mix (percentages) • Critically evaluate your product (age, initial appeal, experience) • Direct Sales Goals • Review marketing – focus on orientation & facilitation • Track – track – track & report • Keep your industry close • Engage your local leaders • Prove your worth
Tourism 2050 • Sustainable Destinations: Economically and environmentally • Authentic & Appealing: Fun!! • Designed for Diverse Visitor Segments: business, meetings, leisure, sports, family gatherings, etc. • Easy to Engage, Plan, & Do: Convenience • Bragging Rights
Thank You Judy L. Randall Randall Travel Marketing PH: 704-799-6512 Email: judy@RTMnet.com Sign up at www.RTMnet.com for research updates & tidbits