Download

1 / 22
220 likes | 353 Vues
Persistence and nonlinearities in Economics and Finance. “I built bustles for all Europe once, but I've been badly hit, Things have decayed in the bustle making trade And that it the truth of it.”

E N D
Persistence and nonlinearities in Economics and Finance “I built bustles for all Europe once, but I've been badly hit, Things have decayed in the bustle making trade And that it the truth of it.” from the poem: “I Was A Bustlemaker Once, Girls” by Patrick Barrington
This presentation is centred around: • modelling and accounting for the rich non-linear dynamics in • macroeconomic • and in financial time series. • Purpose: • to uncover the underlying economic relationships between variables, • to test empirically economic and finance theory, • to integrate these results in economic policy design • as diagnostic tools (e.g. early detection of economic downturns or of price bubbles), • as predictive and forecasting tools (e.g. predict more accurately, over a forecast period, the impact of economic policies), • as modelling tools to help the design of policy at the conceptual stage (i.e. defining and refining how the optimal policy problem is set up). Presentation Chung Cheng, 13 April 2006
This work builds on a joint Rev. Econ. Stud. 2002 paper with Karim Abadir • we developed a general equilibrium macromodel with heterogeneous firms, • calculated its equilibrium and characterized the process of GDP/capita. • We were able to make a prediction on the functional form of its ACF, and it was supported by US and UK data. • Implication: ACF has an S-shape, • initially, a plateau for which memory decreases very slowly, • then a sharp drop, the memory decreases suddenly. • Policy implication: an initial policy input will build-up for the duration of the plateau, ... Presentation Chung Cheng, 13 April 2006
Autocorrelation function for the Log(GDP/Capita) UK, the fit for our AT process and for an AR(2) Presentation Chung Cheng, 13 April 2006
Autocorrelation function for the Log(GDP/Capita) US, the fit for our AT process and for an AR(2) Presentation Chung Cheng, 13 April 2006
Nature of the persistence in macro and financial time series • Aim of this research • establish the nature of the dynamics encountered in macro and finance time series, (joint with Karim Abadir and Giovanni Caggiano) • this dynamics turns out to be non-standard i.e. not well represented by AR processes, • hence the need for a methodology able to handle such dynamics. Presentation Chung Cheng, 13 April 2006
The functional form that we will fit was inspired from the previous RES 2002 work, henceforth referred to as AT. • the Autocorrelation function (ACF) of a time series zt is its correlation with its lagged values. This ACF at lag t is defined as: • The AT functional form of the ACF is a 4 parameters function • The ACF associated with an AR(p) is given by the so-called Yule-Walker equations, for the first p lags, and, for the rest, by the recursion • rt= a1rt-1 + a2rt-2 + .... + aprt-p. Presentation Chung Cheng, 13 April 2006
Implications of the dynamics:movements and co-movements • design an econometric methodology which can distil the co-movements between variables from their own dynamics. (joint with Karim Abadir) • What happens if variables have the previous type of dynamics? • Inertia will mask the true relationship between variables. • Consider a relationship of the typey = Xb + u, where u ~ D(0, S), S generated by the previous dynamics. Presentation Chung Cheng, 13 April 2006
Application I: the UIP anomaly • Efficient market theory posits that the market exploit all available information to price the assets. • In particular, for the exchange rate, consider 2 investment strategies: invest at time t $1 in US denominated asset, let its log return be it. Or invest the same amount in £. The log return, after exchanging your 1 dollar in pounds at st, and exchanging the pounds back into $ at time t+1 isi*t + st+1 - st. Presentation Chung Cheng, 13 April 2006
The difference between the two is called the excess return on investing in foreign assetsrt+1 = i*t – it + Dst+1. • Consider the contemporaneous variable the forward premium: ft – st. • The (future) excess return should be independent of this forward premium. • In practice, one finds a negative relationship. • If one takes into account the AT type of dynamics, one can remove the effect of this dynamics by pre-multiplying the whole equation by a the Choleski decomposition of the covariance matrix S. Presentation Chung Cheng, 13 April 2006
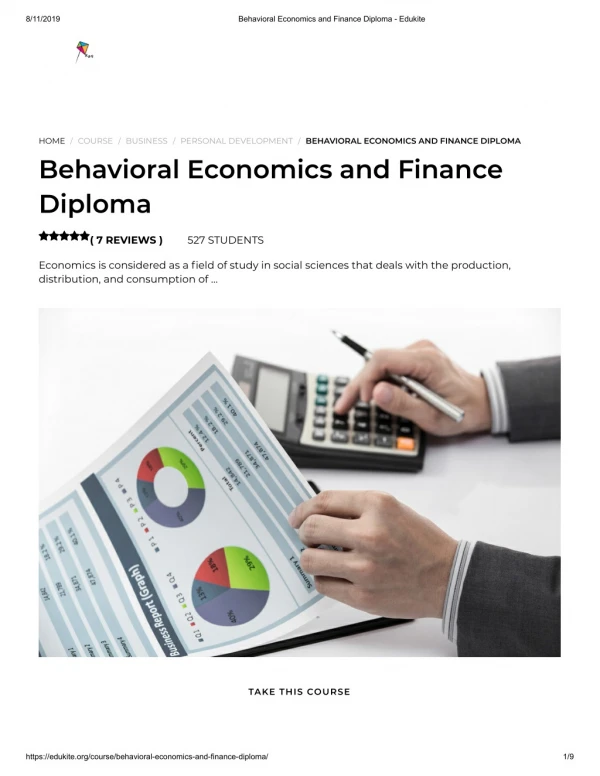
Application II: Stock market. • Efficient market theory is also usually thought to predict that equity prices should follow be martingale. • Looking at the S&P 500 data and GDP, in real terms and in logs, suggests that actually the stock index grows in long cycles around a trend given by GDP. Presentation Chung Cheng, 13 April 2006
Real S&P 500 and real GDP in logs Presentation Chung Cheng, 13 April 2006
The idea is to use an error correction mechanism (ECM) to model the relation between S&P and GDP. • Running such an ECM without taking into account the AT long dynamics produces a regression that is fragile and the explanatory power is not great. Presentation Chung Cheng, 13 April 2006
fit is R2 = 37.4%. • parameters are unstable: Presentation Chung Cheng, 13 April 2006
Performing the analysis using the AT procedure, the stability of the regression is much improved: Presentation Chung Cheng, 13 April 2006
The explanatory power is also improved to 50.8%. The p-value of this improvement is 3.9%. Presentation Chung Cheng, 13 April 2006