
Evaluation of Surface Water Balance in Southeast Asia Using Land Surface Models and ERA-40
This study investigates the water and energy balances in Southeast Asia, a crucial region for food production and vulnerable to climate change. We compare two methodologies: the Variable Infiltration Capacity (VIC) land surface model and ERA-40 reanalysis, assessing their performance in estimating surface moisture and energy fluxes across seven river basins, including Bhutan. Our findings highlight significant differences in precipitation distribution, evapotranspiration rates, and runoff simulations. This research provides vital insights into hydrological processes in a densely populated region, essential for sustainable resource management.

Evaluation of Surface Water Balance in Southeast Asia Using Land Surface Models and ERA-40
E N D
Presentation Transcript
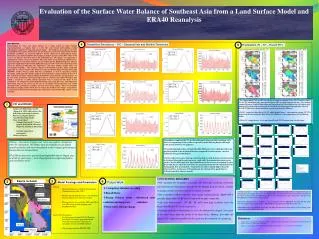
Evaluation of the Surface Water Balance of Southeast Asia from a Land Surface Model and ERA40 Reanalysis 4 Introduction Understanding the water and energy balances of a region (which are linked through evapotranspiration, a common term) is a key first step toward understanding regional hydroclimatic sensitivities to long-term climate change. The Southeast Asia region is one of the most populous on the globe, and therefore key practical issues, such as the region’s food and fiber production capabilities, are intricately linked to possible changes in its hydroclimatic regime. Furthermore, the region contributes much higher particulate organic carbon (POC) fluxes to the sea on a per unit area basis than most of the global land area. We compare two approaches to estimating the surface energy and moisture flux terms under recent historical conditions for a region consisting of seven major southeast Asia river basins plus the Kingdom of Bhutan. The first approach is application of the Variable Infiltration Capacity (VIC) land surface hydrology model forced by gridded precipitation and temperature, and other gridded radiant fluxes and meteorological variables. The second is analysis of the ERA-40 reanalysis, which result from application of a frozen version of the European Centre for Medium Range Weather Forecasting (ECMWF) weather forecast model with data assimilation as used in operational weather forecasting. Both approaches produce gridded (at one-half degree spatial resolution in the case of VIC, and about one degree spatial resolution for ERA-40) surface moisture and energy fluxes. In the case of VIC, both water and energy budgets close by construct, where ERA-40 budgets must include a non-closure (so-called analysis increment) term to account for the effects of data assimilation. We compare the model-simulated moisture and energy flux terms with independent observations from in situ sources (in the case of streamflow and precipitation) and satellite (downward solar and longwave radiation, and total water storage change). Observed streamflow from different gauging stations will be used to evaluate the modeled water balance. Computations are also made of estimates from both approaches of moisture recycled within SEA, and its seasonal variations. 5 Streamflow Simulations – VIC – Seasonal flow and Monthly Timeseries Precipitation (P) – ET – Runoff (RF) Mekong at Mukdahan Mekong at Chiang Sean Mekong at Chiang Sean Mekong at Mukdahan R2 = 0.91 NS = 0.80 R 2 = 0.93 NS = 0.83 M = 1687.5 mm SD = 776.5 mm M = 1944.3mm SD = 654.9 mm M = 847.6 mm SD = 298.8 mm M = 946 mm SD = 232.9 mm Mekong at Nong Khai Mekong at Luang Prabang Mekong at Nong Khai Mekong at Luang Prabang M = 853.3mm SD = 511.5 mm M = 317.1 mm SD = 272.3 mm R2 = 0.92 NS = 0.83 R2 = 0.94 NS = 0.85 • The annual mean P, ET and RF over the seven basins are shown above. The P range is higher for the VIC simulation (380– 4400 mm) than for ERA-40 which ranges from 560 – 3400 mm per annum. However, both of them show similar patterns in P distribution over the region with highest P for Irrawaddy and lowest P in the north of Salween and Mekong basins. Overall, the VIC P field shows more variability over the area than the ERA40 P. • ERA ET varies less than that of VIC ET, which ranges from 0 – 2900 mm per annum. VIC ET is highest in the Sittang basin while ERA40 ET is highest in the southern part of the Mekong basin. • ERA40 RF ranges from 2 – 2200 mm annually and VIC RF ranges from 2 to 2800 mm. 1 VIC and ERA40 • Large scale hydrologic model (Liang et al. 1994 ) that solves: the full water and energy balances • Run at 1/4 degree spatial resolution for this study • Uses as an input: • Climatic forcing (P, T, wind speed), downward solar and longwave radiation, humidity • Soil and vegetation parameters • Three soil layers Mekong at Pakse Irrawaddy Sagaing Irrawaddy at Sagaing Mekong at Pakse R2 = 0.92 NS = 0.81 R2 = 0.96 NS = 0.92 Red River- PPTN Chao-Phraya - PPTN Irrawaddy- PPTN Mekong - PPTN PPTN, mm/month PPTN, mm/month PPTN, mm/month PPTN, mm/month Chao-Phraya - RF Red River- RF Irrawaddy- RF Mekong - RF • Streamlows simulated by VIC for the different basins are well correlated with their corresponding observed flow especially in the Mekong Basin, although some seasonal biases are apparent • The relatively high values of Nash-Sutcliffe Efficiency (NS), which describes the prediction skill of the modeled flows as compared to observations, are also indicative of a good simulation • For the other two basins, Sittang and Irrawaddy, for which observed stream flow is obtained (though for only ten years, 1978-1988), the simulations were not as good as for the Mekong basin. Investigation as to the reasons is ongoing. For the Irrawaddy basin, while the low flows are simulated well, the VIC simulated flows during peak flow months July – September are substantially higher than the observed flow. In the case of Sittang basin, the timing of the peak flows is shifted forward by about a month. • ERA40 - Reanalysis (Uppala et al. 2005) was used for comaprison with VIC simulation. The ERA40 data are available at 1.125 degree spatial resolution and were interpolated to the ¼ degree grid using an inverse distance interpolation. • The ERA40 data cover 45 years from September 1957 to August 2002 of which 32 years (1970 – 2001) of precipitation, evapotranspiration and runoff were used. RF, mm/month RF, mm/month RF, mm/month RF, mm/month Sittang at Toungoo Sittang at Toungoo Chao-Phraya - ET Irrawaddy- ET R2 = 0.75 NS = 0.55 Mekong - ET Red River- ET Sittang - PPTN Songma - PPTN Salween- PPTN ET, mm/month ET, mm/month ET, mm/month ET, mm/month PPTN, mm/month PPTN, mm/month PPTN, mm/month Key M = Mean SD = Standard Deviation PPTN = Precipitation RF = Runoff ET = Evapotranspiration NS = Nash-Sutcliff Efficiency Songma - RF Salween- RF Sittang - RF RF, mm/month RF, mm/month RF, mm/month Sittang - ET Songma - ET Salween- ET ET, mm/month ET, mm/month ET, mm/month • CONCLUDING REMARKS • VIC simulated the streamflow reasonably well with high correlation coefficients and Nash-Sutcliffe efficiencies especially for the Mekong basin for which a number of gauging stations with observed flow records are available. • The P and RF by ERA40 and VIC show similar seasonal patterns. ERA40 RF is generally higher than VIC RF while P from both are quite comparable. • All water balance terms , VIC RF, ET and P show high variability across the basins than ERA RF, ET and P, respectively. • Although streamflow observations are yet to be obtained for complete assessment of the entire basin, from the results of the three basins, Mekong, Irrawaddy and Sittang, VIC simulation capability for the region can be considered very promising. 3 6 2 Basins included Model Forcings and Parameters Future Work Mekong • Forcing • Min/max Temperature (T) data obtained from Climate Research Unit (CRU) • Monthly precipitation (P)statistics was obtained from the University of Delaware (UDel) • Missing data for observed data (CRU and UDel) was filled using quantile mapping with NCEP/NCAR data. • Computing Moisture recycling • Runoff Ratio • Energy Balance terms ( downward solar radiation and long-wave radiation) • Total water storage change • . • All the basins have a clearly defined P cycle that peaks during the months of June to September except for Chao-phraya and Songma which have two peaks in May and September. For these two basins and Salween the VIC P is always lower than ERA40 P; while for the remaining basins they match each other quite well. Both ERA40 and VIC P show similar patterns. • RF shows similar pattern as P. There is a big discrepancy between ERA40 RF and VIC RF. Especially between months of May and November , ERA40 RF is much higher than VIC RF for all basins. • ERA40 ET varies very small throughout the year while VIC ET has the same pattern as VIC P having peaks during the months of June to September. Salween Irrawaddy Red River Song Ma • Land Surface Parameters • Soil data prepared using FAO Soil Program. Soil depth was initially approximated and corrected using iterative calibration of streamflow by the UA-SCEM method • Veg data prepared from MODIS 2000. • References • Liang, X., D. P. Lettenmaier, E. F. Wood, and S. J. Burges, A Simple hydrologically Based Model of Land Surface Water and Energy Fluxes for GSMs, J. Geophys. Res., 99(D7), 14,415-14,428, 1994 • Uppala, S. M., and Coauthors, 2005. The ERA-40 Re-analysis. Quart. J. Royal Meteor. Soc., 131, 2961-3012, doi:10.1256/qj.04.176. Sittang Chao Phraya


