Download
1 / 14
150 likes | 302 Vues
Jump on the Conveyor Belt. EARTH 2007 Joanne Vanderhorst. Summary. Students will understand that we are all part of the same ocean as they explore individual sections of the world’s oceans. The students will use Giovanni to jigsaw together a collage of the sea surface temperature of ocean.

E N D
Jump on the Conveyor Belt EARTH 2007 Joanne Vanderhorst
Summary • Students will understand that we are all part of the same ocean as they explore individual sections of the world’s oceans. The students will use Giovanni to jigsaw together a collage of the sea surface temperature of ocean.
Key Concepts • Consequences occur everywhere if any location along the ocean conveyor belt is disturbed. • Scientists use technology and real time data to answer questions and make predictions • Giovanni is a web-based data exploration system that enables rapid data access, analysis, and visualization.
Objectives Students will be able to: • Understand the power of real time data; • View and collect data using Giovanni; • Create maps on SST with real time data; • Understand we are part of one large ocean; • Infer consequences that could result if any location along the ocean conveyor belt were disturbed.
Materials • Computers with Internet access • Large place on classroom wall • Coloring Utensils
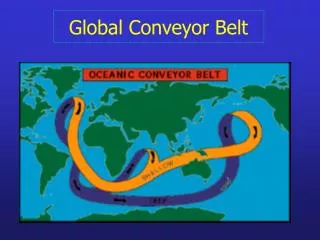
Introductory Activity • Give groups a world map which includes the conveyor belt cut into pieces. • Assemble map and answer the following questions: • What does the map demonstrate? • What do the arrows in the ocean mean? • Why is this information important?
Procedure • Introduce ocean conveyor belt. • Students should understand the global ocean is not a static pond, but a body in constant motion and the effects of temperature change in one part of the world have consequences on us all. • Discuss RTD collecting and importance. • Provide each group with a section of a world map. • Older students may be given a range of latitude and longitude
Giovanni • Students generate and record SST for the most recent season. • This activity can be done monthly as well.
Student transfer information generated in Giovanni to a map. Groups share information as maps are added Draw the ocean conveyor belt arrows. Discuss interconnectivity of oceans, SST, ocean conveyor belt and climate change.
Recall and Infer • What does the image depict? • What do the colors represent? • Pattern in SST • Coldest and warmest locations • Water movement • Measurement of x,y axis • How does this information help people who work on the water?
Extensions/Enrichment • Interview commercial fishermen. Chart fish caught in warm water verses cold water. • Which marine animals live in cold or warm water. • Group by mammals, fish, and invertebrates. • Record their location and temperature. • Interview local weather reporters to discover where they get their information. • Investigate the way real time data is collected.
Performance Students will navigate and collect real time data via the Giovanni system. Product Using Giovanni, students will to produce a map representing the SST of their assigned area and combine that map with other groups’ maps to create a representation of the ocean’s conveyor belt. Assessment