Chapter 16: Population Genetics & Speciation
340 likes | 503 Vues
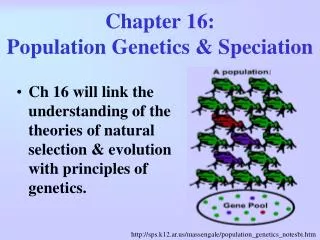
Chapter 16: Population Genetics & Speciation. Ch 16 will link the understanding of the theories of natural selection & evolution with principles of genetics. http://sps.k12.ar.us/massengale/population_genetics_notesbi.htm. I. Genetic Equilibrium. Traits vary within a population

Chapter 16: Population Genetics & Speciation
E N D
Presentation Transcript
Chapter 16:Population Genetics & Speciation • Ch 16 will link the understanding of the theories of natural selection & evolution with principles of genetics. http://sps.k12.ar.us/massengale/population_genetics_notesbi.htm
I. Genetic Equilibrium • Traits vary within a population • Population Genetics – the study ofevolution from a genetic point of view. Population biologists –study many different traits in populations -such as size and color. Charles Darwin's first sketch of an evolutionary tree from his First Notebook on Transmutation of Species (1837) http://en.wikipedia.org/wiki/Speciation
2. Microevolution • a small- scale change in the collective genetic material (alleles) of a population. • Microevolution can be contrasted with macroevolution; which is the occurrence of large-scale changes in gene frequencies, in a population, over a geological time period (i.e. consisting of lots of microevolution).
** remember: - alleles-are the variations in genes that code for traits) • population- is a group of individuals of the same species that routinely interbreed. A population is the smallest group in which evolution is observed. • Individuals do not evolve, populations do.
3. Standard Bell Curve • Traits vary among individuals & can be mapped • Shows that most individuals have average traits • a few individuals have extreme traits.
4. Causes of Variation of Traits Variations in genotype arise by -mutation(random change in a gene) -recombination(reshuffling of genes in an individual- remember meiosis- crossing over, Independent assortment) -random pairing of gametes(many gametes, chance union)
B. The Gene Pool • The total genetic information available in a population. • Imagine a “pool” with all the possible genes for the next generation in it. - then make a set of rules to predict expected genotypes • So agene pool is the sum of all the individual genes in a given population.
1. Allele frequency The frequency of an allele is the number of occurrences of that allele in that population -Within a gene pool, every allele or gene variant has a particular ratio or frequency. -is determined by dividingthe total number of a certain allele by the total number of alleles of all types in the population.
2. Review of phenotype & genotype • Genotype- is the actual genetic information (the combo of alleles for traits.) • Three different genotypes: BB (homozygous dominant) Bb (heterozygous) bb (homozygous recessive) • Phenotype- what is seen. • 3 genotypes , in complete dominance- show 2 phenotypes: long bristles (BB and Bb),
3. Predicting Phenotype • Phenotype frequency • Predicting Phenotype • Phenotype frequency is equal to the number of individuals with a particular phenotype divided by the total number of individuals in the population. b. Counting & calculating 1. Count the alleles of each type in each generation. Example- 12 R, 4r total 16 alleles in 8 individual in 1st generation 2. Divide the type of each allele by the total number of alleles. Example- 12/16 = R = 0.75 & 4/16 = r = 0.25
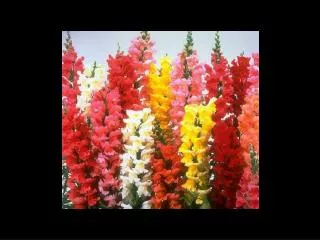
Phenotype Frequency The four o’clock flower illustrates how phenotype changes from generation to generation. Compare 1st & 2nd generations. Note that although the phenotypes change the allele frequencies remain the same.
Gene pool EXAMPLE: 15 individuals in the population (each organism has 2 alleles per trait), thus = 30 alleles for trait - if 6 alleles in this population are of the b variety, & 24 are of the Bvariety, then frequencies of alleles are: * 6/30 of the genes in the gene pool are b - a frequency of 0.2 * 6/24 of the gene in the gene pool are B - a frequency of 0.8. Together, 0.2 + 0.8 = 1.0 (all the genes, 100%) http://www.brooklyn.cuny.edu/bc/ahp/LAD/C21/C21_GenePool.html
Law of probability Thechances of 1 gamete having an allele & meeting with any other allele is expressed: frequency of R X frequency of R = frequency of RR pair (example: 0.75 X 0.75 = 0.5625) Frequency of r X frequency of r = frequency of rr pair (example: 0.25 X 0.25 = 0.0625) So that the frequency of Rr can be figured out by subtracting the sum of RR + rr from 1.0. (example 1.0 – (0.5625 + 0.0625) = 0.375 (Rr pairing)
C. Hardy-Weinberg Genetic Equilibrium • Englishman HARDY & German WEINBERG • Showed frequency of alleles in a population stays constant for generations if certain conditions are fulfilled. • In other words-Allele frequencies in the gene pool do not change unless acted upon by certain forces. • Hardy-Weinberg genetic equilibrium is a theoretical model of a population in which no evolution occurs & the gene pool of the population is stable.
Five conditions for hypothetical H-W population 1. No net mutations occur (# alleles remain the same) 2. No Individuals enter or leave the population (Immigration or Emigration) 3. The population is LARGE 4. Individuals must mate randomly 5. Natural selection does not occur. **Genetic Equilibrium is a theoretical state. Real populations probably do not meet all these conditions. Use equation to see causes of DISRUPTION of genetic equilibrium
II. Disruption of Genetic Equilibrium • Mutation • Evolution may take place when populations are subject to genetic mutations, gene flow, genetic drift, nonrandom mating, or natural selection. • Mutations are changes in the DNA.
B. Gene Flow 1. Immigration – movement of individuals into the group 2. Emigration-movement of individuals out of the group • Emigration and immigration cause gene flow between populations and can thus affect gene frequencies. • Example-males of baboon troops- fight for dominance of group of females. Females tend to stay in troop born into. Less dominant or younger males move to a different troop. This ensures gene flow.
Genetic Drift • Genetic Drift- the phenomenon by which allele frequencies in a population change as a result of random events or chance. • Genetic drift refers to the expected population dynamics of neutral alleles (those defined as having no positive or negative impact on fitness) (Natural selection describes the tendency of beneficial alleles to become more common over time (and detrimental ones less common), genetic drift refers to the tendency of any allele to vary randomly in frequency over time due to statistical variation alone.)
C. Large populations • Large populations tend to stabilize allele frequencies. • Genetic drift is more pronounced in small populations where failure of even a single individual to reproduce can change allele frequencies in the next generation. • See graph page 322
D. Non- random mating (Sexual selection) • Mating is nonrandom whenever individuals may choose partners. • Sexual Selection • Sexual selection occurs when certain traits increase an individual’s success at mating. • Sexual selection explains the development of traits that improve reproductive success but that may harm the individual.
*Females are the limiting sex - invest more in offspring than males -many females are unavailable for fertilization (because they are carrying for young or developing young) -males tend to be in excess *Sexual selection arises in response to either: 1. Female Choice: Intersexual selection, in which females choose males based upon elaborate ornamentation or male behaviors, or 2. Male Competition: Intrasexual selection, in which males compete for territory or access to females, or areas on mating grounds where displays take place. Male-male competition can lead to intense battles for access to females where males use elaborate armaments (e.g., horns of many ungulates). http://bio.research.ucsc.edu/~barrylab/classes/animal_behavior/SELECT.HTM
E. Natural selection • One of the most powerful agents of genetic change • can influence evolution in one of three general patterns: 1. Stabilizing selection- favors the formation of average traits. 2. Disruptive selection -favors extreme traits rather than average traits. 3. Directional selection -favors the formation of more-extreme traits.
Stabilizing Selection • Reduces variation • Favors individuals with an average phenotype over the extremes. • Example: • very large fish cannot hide under rocks • very small fish move too slowly • predators eat both of these extremes • average sizes survive best Next 3 diagrams: http://bio.research.ucsc.edu/~barrylab/classes/animal_behavior/SELECT.HTM#anchor269237
Disruptive Selection • Selects for phenotypes at both extremes • can creative two distinct distributions from a single distribution. • Example • large & small seeds available to eat • Birds with very large and very small beaks survive best • Average sizes not best suited for survival.
Directional Selection -A response to a change in the environment can select for traits above or below average - we see a shift in the mean for the trait (either up or down)
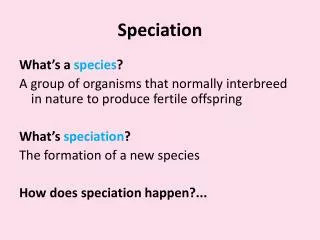
III. Formation of Species A. Definition of species 1. Morphological- a species is a populations of organisms that look alike (same structures & appearance) 2. Biological -a species is a population of organisms that can successfully interbreed but cannot breed with other groups. Combined definition- a species is a group of organisms that look alike & can successfully interbreed to create fertile offspring.
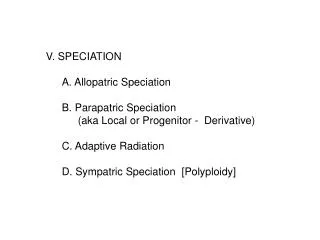
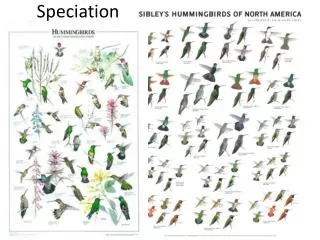
B. Isolation & Speciation 1. Geographical Isolation & Allopatric speciation • Results from the separation of population subgroups by geographic barriers. • Geographical Isolation may lead to allopatric speciation (Happens when species arise as a result of geographical isolation)
2. Reproductive Isolation • results from the separation of population subgroups by barriers to successful breeding. a. Prezygotic isolation – occurs before fertilization. examples- different sizes-body structure prevents mating, different mating ritual or behavior, different breeding time, not recognizing songs or calls. b. Postzygotic isolation – occurs after fertilization. examples- embryo does not develop or creates a hybrid organism that is infertile or weaker
Sympatric speciation • Reproductive isolation within the same geographic area is known as sympatric speciation. • May occur to give adaptive advantage to organisms that use slightly different niches.
C. Rate of Speciation • Gradualism -The gradual model of speciation -species undergo small changes at a constant rate. 2. Punctuated Equilibrium - new species arise abruptly - differ greatly from their ancestors, and then change little over long periods.
The illustration below shows two contrasting models for rates of speciation. Which model of speciation rates is illustrated by model A in the graph? F. gradualism G. sexual selection Gradualism Punctuated equilibrium
Questions: 1. Which type of selection is modeled in the illustration? What might cause this ? 2. What is the term for the total genetic information in a population? 3. Saint Bernards and Chihuahuas (two breeds of domestic dogs) cannot normally mate because they differ so much in size. Thus, they are reproductively isolated to some extent. What type of isolating mechanism is operating in this case? Directional, change in the environment. Gene poolprezygotic
Hardy Weinberg Equation • The gene frequency of a population in Hardy-Weinberg Equilibrium is written as: pp : 2pq : qq • where p = the frequency of the dominant allele, and q = the frequency of the recessive allele. It follows that p + q = 100% of all the genes in the gene pool. • When you have allele frequencies, you can then calculate genotype frequencies using the H-W equation, (AA) = p2, (Aa) = 2pq, and (aa) = q2.
Example: • 16 pigs with 4 of them black (recessive aa). • 16 pigs are 100% • 4 pigs are 25% (aa 25%) therefore: q2=0.25 -------> q=0.5 p + q = 1 ---------->p + 0.5 = 1 -----> p = 0.5 • AA (homozygous) are p2---->0.5X0.5= 0.25 = 25% • 2Aa (heterozygotus) are 2pq----> 2 x (0.5) x (0.5) = 0.5 = 50% so the equation is: AA + 2Aa + aa = 1 25% + 50% +25% = 1