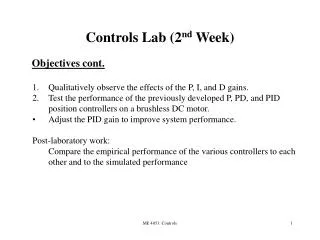
Controls Lab (2 nd Week)
Controls Lab (2 nd Week) . Objectives cont. Qualitatively observe the effects of the P, I, and D gains. Test the performance of the previously developed P, PD, and PID position controllers on a brushless DC motor. Adjust the PID gain to improve system performance. Post-laboratory work:

Controls Lab (2 nd Week)
E N D
Presentation Transcript
ME 4053: Controls Controls Lab (2nd Week) Objectives cont. • Qualitatively observe the effects of the P, I, and D gains. • Test the performance of the previously developed P, PD, and PID position controllers on a brushless DC motor. • Adjust the PID gain to improve system performance. • Post-laboratory work: • Compare the empirical performance of the various controllers to each other and to the simulated performance
ME 4053: Controls Apparatus • PC • Quanser Data Acquisition • Amplifier • Motor and Flywheel • Encoder
ME 4053: Controls R(s) E(s) V(s) (s) C(s) = (s) GS GP Background – PID Performance Motor Transfer function (Position output) PID controller transfer function Feedback control block diagram Figure 7. Control Feedback Block Diagram
ME 4053: Controls Procedure: Qualitative Observations 1. Use “ControlsQualitative.mdl” as shown on Figure 5. 3. Specify gains (Kp,Ki,Kd) for P controller. 4. Build model, Connect to Target, and hit Start (play) 5. For each controller turn the flywheel with your hand: (1) quickly, (2) slowly, and (3) turn and hold in position. 6. What aspect is the restoring force sensitive to? Record your observations in your lab notebook. 7. Repeat for I and D controllers.
ME 4053: Controls Figure 5. SIMULINK Model for Qualitative Observations
ME 4053: Controls Procedure: PID Controller Performance 1. Open Control2.mdl Set constants according to TA instructions 2. Set Kp, Ki, and Kd to the values you calculated for each of the controllers. 3. Build the model, Connect to Target, hit Start (play) 4.Plot the results and save as a figure file 5. Repeat for the PD and PID controllers.
ME 4053: Controls 30 Pulse Generator Constant Block Diagram to Initiate Position Control of Motor VALUES ASSIGNED IN Procedure! From : Simulink : Source (use time based) From : Simulink : Source Parameters Parameters Amplitude: Constant Value : Period : Pulse width : Phase Delay : Figure 8. SIMULINK Model used for Position Control of DC Motor
ME 4053: Controls HIL READ ENCODER HIL WRITE ANALOG Encoder Input Analog Output 25s -K- s+25 Transfer Fcn Gain 0 Constant Sum Simulink and Quanser Blocks From : Quanser Library: Quanser Consulting MQ3 Series From : Quanser Library : Quanser Consulting MQ3 Series (leave parameters as default) (leave parameters as default) From : Simulink : Math Parameters Gain : 1/2000 From : Simulink : Source Parameters From : Simulink : Continuous Constant Value : 0 Parameters Numerator : [25 0] From : Simulink : Math Denominator : [1 25] Parameters List of signs : |++ List of signs : |+++ Figure 9. SIMULINK and Quansar Blocks Used in Position Control
ME 4053: Controls Max. Overshoot 2% Settling time Procedure: PID Controller Performance 2 SCORE-Change • Open M Files. • Measure the maximum overshoot, the 2% settling time, and the steady-state error for each graph (where applicable) and record the information in Table 1. See Figure 4 for an example. • Calculate the “score” for the performance of the controller. • S=Omax x tsettle if steady state error is less than or equal to 0.5% • Adjust the gains of the best PID controller to improve the performance of the controller. Record the gains and the scores for each attempt in Table 1. Figure 10. Example measured quantities: settling time and max overshoot.
ME 4053: Controls Non-Linear Simulink Model Verification: • Build the following Non-Linear Model to compare to experimental results. • The Transfer Fcn2 on the right is really just (Km / (Tm*s^2 + s)). • To Run your simulation, make sure to go to Simulation, then Configuration Parameters, and run Ode5, with a step size of 0.005. This will make your simulation run much quicker. Feel free to vary these values to make a higher resolution plot. • Slight modification to this model will give a linear version – to be tested as well. Which model works better? See Procedure Pulse Generator See Procedure Figure 11: Non-Linear Model
ME 4053: Controls Controller Kp (units) Ki (units) Kd (units) Max Overshoot (%) Settling Time (s) Steady-State Error (%) Score Ess<=0.5% Pth Pexp PDth PDexp PIDth n=n1 PIDexp n=n1 PIDth n=n2 PIDexp n=n2 PIDth n=n3 PIDexp n=n3 PIDadj PIDadj PIDadj Controller Performance Results Table 4. Simulation and experimental performance results for various controllers.