Volumetric Analysis – Titrations
Volumetric Analysis – Titrations. Volumetric Analysis a process of analysis accomplished by adding together particular volumes of 2 solutions the objective may be to determine the molar concentration of a solution of unknown strength, the percent purity of a sample, etc. Titration

Volumetric Analysis – Titrations
E N D
Presentation Transcript
Volumetric Analysis – Titrations Volumetric Analysis • a process of analysis accomplished by adding together particular volumes of 2 solutions • the objective may be to determine the molar concentration of a solution of unknown strength, the percent purity of a sample, etc.
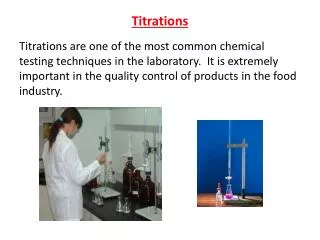
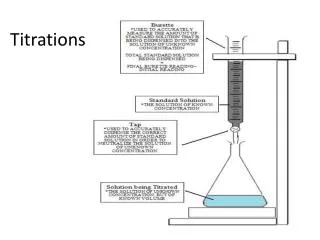
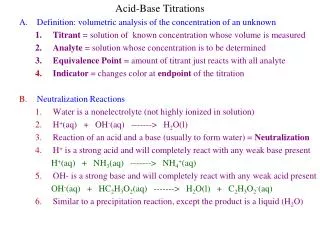
Titration • that part of a volumetric analysis which is carried out by carefully adding a controlled volume of one substance to another sample by use of a burette Endpoint • that point reached in a titration when enough of one reagent has been added to just completely react with the other reagent and produce a colour change in the indicator being used E.g. A + 2B C + D • An endpoint would be reached when enough A (.30 moles) has been added to just use up the amount of B that was present (.60 moles). Endpoints are usually signaled by the colour change of an indicator.
Behavior of Indicators The way indicators like phenolphthalein, litmus, & bromthymol blue change colour is readily explained on the basis of equilibrium shifts. Acid-base indicators are really just very weak acids or bases which are slightly dissociated and set up equilibrium between the molecular and ionic forms, which are different colours.
Example: phenolphthalein (HPh) It is a weak acid which in water sets up this equilibrium: HPh + H2O H3O+ + Ph- • In an acid solution the [H3O+] is large, the equilibrium is shifted far to the left to form colorless HPhmolecules • In a basic solution the OH- ions use up the H3O+ ions in the reaction (H3O+ + OH- 2H2O). The system shifts to the right to produce more H3O+ and red Ph- ions. • Some texts use the symbol HIn to signify an indicator. Using bromthymol blue as an example we have: Equilibrium: HIn + H2O H3O+ + In-
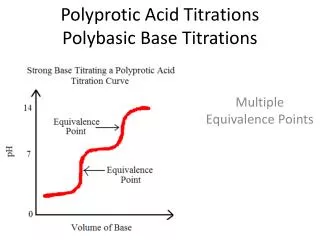
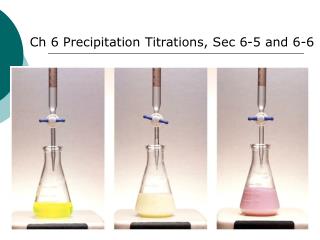
Titration Curve • This is a graph which shows how the pH changes during a titration. • GENERAL SHAPES: 1) Acid titrated with a base. At the equivilence or endpoint [H3O+] = [OH-] This is where the indicator colour changes & pH changes rapidly.
2) Base titrated with an acid. At the top of the graph the [OH-] > [H3O+]. At the endpoint the concentrations are equal. At the end of the graph [OH-] < [H3O+].
Sample Problems: 1. Find the concentration of an H2SO4 solution if 15.0 mL of it is needed to neutralize 40.0 mL of 0.60 M NaOH solution, according to the equation: 2NaOH + H2SO4 Na2SO4 + 2H2O
What volume of 3.00 M HCl can be neutralized by a reaction with 13.4 g of sodium carbonate? Na2CO3 + 2HCl 2NaCl + H2O + CO2
Percent Purity by Volumetric Analysis Find the percent purity of a sample of Na2CO3 if 250.0 mL of 0.300 M HCl is required to react completely with a 5.0 g sample of the impure salt. Rxn: Na2CO3 + 2HCl 2NaCl + H2O + CO2