Download
1 / 5
50 likes | 154 Vues
“Noi Italia 2011 - 100 indicators to understand Italy” An overview – The Home Page. 120 indicators are proposed, arranged 19 thematic sectors ranging from economic, social, demographic and environmental fields. . 1.

E N D
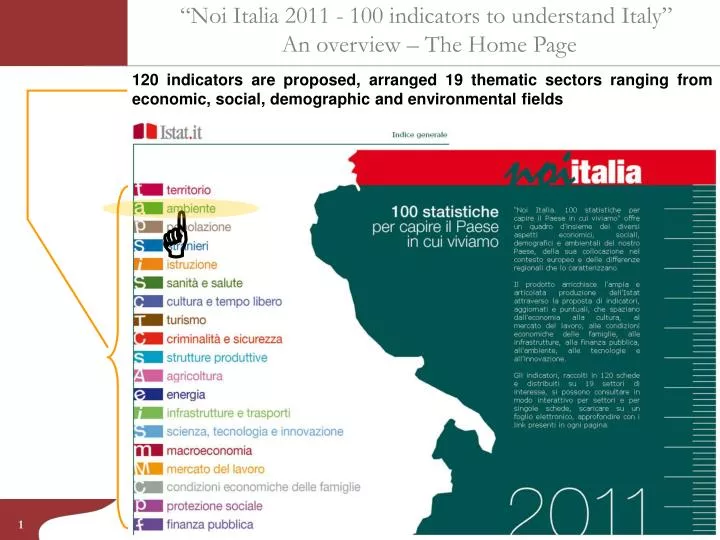
“Noi Italia 2011 - 100 indicators to understand Italy” An overview – The Home Page 120 indicators are proposed, arranged 19 thematic sectors ranging from economic, social, demographic and environmental fields 1
“Noi Italia 2011 - 100 indicators to understand Italy” An overview – The second level Spotlights on the Indicators Indicators per Sector Highlights on Sector 2
“Noi Italia 2011 - 100 indicators to understand Italy” An overview – The Indicator level • Download area • graphs for all EU countries; • tables with the last years data for Italian regions (NutsUTS2); • map for Italian regions related to the most recent data; • time series for the indicator. Thematic topic at a glance • Metadata area • definition of indicator and measurements unit. Dynamic graph Comparison of EU countries Sources, Publications and Web links area Storytelling Embedding code Choropleth map Comparison of the Italian regions (Nuts2) Dynamic graph Dynamic Bar chart Time Series animation Embedding code Storytelling 3
Bibliography: http://www.cros-portal.eu/filedepot_download/88/76/0/edit http://epp.eurostat.ec.europa.eu/portal/page/portal/statistics_policymaking_europe_2020/documents/Jern.pdf
http://noi-italia.istat.it/ Contents: Mara Cammarrota cammarro@istat.it Valeria de Martino valedema@istat.it Alessandra Ferrara ferrara@istat.it Stefania Rossetti strosset@istat.it Technical information and dynamic graphs: Stefano De Francisci: defranci@istat.it Michele Ferrara: miferrar@istat.it Antonio Pitrone: pitron@istat.it Grazie