TROI – SPC Database Walkthrough
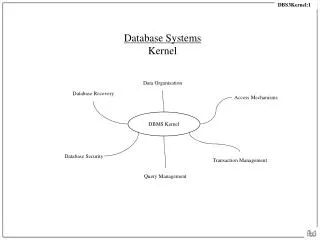
TROI – SPC Database Walkthrough. Training Presentation. SPC Walkthrough SPC Client. SPC Database. The TROI system utilizes a database system we know as SPC. It captures all inspection data for every pad good or bad. Then stores it indefinitely to the desired location.


TROI – SPC Database Walkthrough
E N D
Presentation Transcript
TROI – SPC Database Walkthrough Training Presentation Doc. USTP0213 Rev4
SPC Walkthrough SPC Client Doc. USTP0213 Rev1
SPC Database The TROI system utilizes a database system we know as SPC. It captures all inspection data for every pad good or bad. Then stores it indefinitely to the desired location. We provide a tool called SPC client to open and view the raw data that is collected. You will find a link for this in the SPI software labeled “SPC”. With the SPC client tool you will be able to quickly create a variety of reports, charts, review NG pads in 3D and or view & pull raw data to be handled accordingly. Doc. USTP0213 Rev1
Logging In Once logged into windows SPC database server will automatically start; then it’s possible to log in with the SPC Client and review collected data. Then, go to : File > Enter your login information First, activate the link on your windows desktop or from within the SPI software. Select User then press Connect. Select auto connect for ease of access. Note: If logging in for the first time go to “Setting(s)” to setup a new user. Doc. USTP0213 Rev1
New user information To configure new SPC Users Go to “File” > “Settings” Click “NEW” Then Enter Appropriate Settings IP, USER, PASS and Port number. Note: This Information is set within the SPC server. Doc. USTP0213 Rev1
Searching Filter data by time; select time then click “Time Sync” to activate. Opening a product to view data- Statistics Chart – Creates a statistics chart Process Chart – Creates a process chart Work Data search – Pulls the main list of inspection data and subcategories (review section 9c for details on this) Report – Creates an automatic report for the selected product(s) Refresh – Refreshes product list Search for a specific product by typing the name here Doc. USTP0213 Rev1
Search and Export You will notice similar export buttons on most windows within the SPC client. Use these to Export data in an easy to read format such as an Image, CSV, Excel, PDF or Word file. Edit viewed & exported data columns Use the text fields or check boxes to search for a specific inspection. Export raw data directly to CSV file. Doc. USTP0213 Rev1
Work DATA Search Common Functions Array data - View Data by Block/Array Component Data - View Data by Component (example. C43, U1) Histogram - View data as Histogram Chart PCB Viewer - Select one or multiple pads using a PCB graphic as a reference Viewer - View defect data from NG results or PCB view used to run GRR and other test on specific pads or all pads. Chart – View Data as a chart Worst Pad Analysis – View worst pad NG data Group – View Group Data (if created) Delete- Deletes Data “Right Click” after desired data is filtered and highlighted. Note: Data will only be pulled for what is highlighted. Use Ctrl+Ato select all data Doc. USTP0213 Rev1
DATA LIST VIEW Select the appropriate check box(s), inspection, pad and or component. Click “Refresh” to populate the data list. This applies to all other windows as well through SPC client. When using Data list view; Inspections by default will be listed to the left. Cycle to the Array tab to open results for individual pads. Review and or Export Data Doc. USTP0213 Rev1
Worst PAD List Worst PAD List will list all historical NG data by Array, PAD and or Component. Data will be listed as a chart and a PCB legend will be presented so location can be quickly identified Right a select to bring a detailed list in the defect viewer by selected data only. Doc. USTP0213 Rev1
Defect Viewer The Defect viewer will list data that the system called NG. It will display a PCB image, 2D & 3D image of the pad selected. Also listed is a chart that shows control limits and readings. View 3D/2D Here PCB LEGEND Doc. USTP0213 Rev1
Histogram Select the desired format then click refresh. View average and trend data by a histogram. Utilize the image capture or settings button to capture or make changes. Doc. USTP0213 Rev1
Charts Run Process and Statistic charts based on the data selected previously. Utilize the settings tool if limits should be adjusted to match specs. Doc. USTP0213 Rev1
PCB Viewer This is the SPC client PCB Viewer. From here you can use a PCB graphic to find and select pads of your choosing to review & run data Use Tools here to select data Right Click Data for more options; run Histogram chart, Data viewer, or run a GR&R report on your selected pads and inspections. Selected data values may be viewed here. Doc. USTP0213 Rev1
Report Generator Report Generator will easily create charts for you. Select the report type, period, model(s) to be included. After the report is generated it may be exported to word, excel or PDF formats. Doc. USTP0213 Rev1
Settings and Customization You may change how many results are displayed by going to settings. . Go to File > then Settings Browse through tabs to view and or change SPC client settings. Doc. USTP0213 Rev1