Download
1 / 31
310 likes | 489 Vues
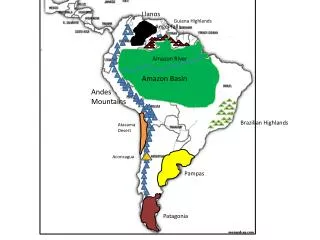
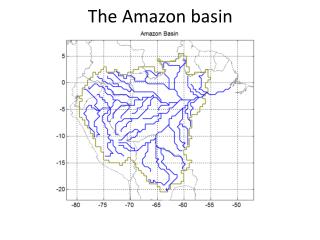
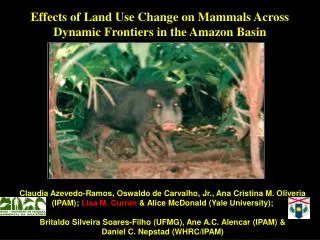
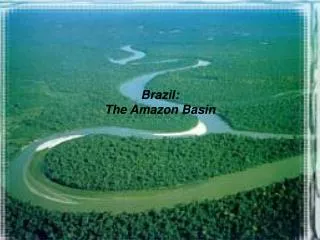
Climate Effects of Amazon Basin Plant Types. Lei Huang 04/22/2008. Map of the Amazon Basin in South America. Change area: 15 ˚S ~0 ˚, 285˚E~310˚E. Deforestation in the Amazon.

E N D
Climate Effects of Amazon Basin Plant Types Lei Huang 04/22/2008
Map of the Amazon Basin in South America Change area: 15˚S~0˚, 285˚E~310˚E
Deforestation in the Amazon Deforestation in Brazil: This image of the southern Amazon uses satellite data from the MODIS on the Terra satellite collected in 2000 and 2001 to classify the terrain into three separate land surface categories: forest (red), herbaceous (non-woody) vegetation like grasses (green), and bare ground (blue). The Amazon’s numerous rivers appear white. Brazilian deforestation is strongly correlated to the economic health of the country: the decline in deforestation from 1988-1991 nicely matched the economic slowdown during the same period, while the rocketing rate of deforestation from 1993-1998 paralleled Brazil's period of rapid economic growth.
Land-cover Categories in CLM • CLM land-cover data has total 15 categories called PFTs (Plant Functional Types). Seven primary PFTs (needle-leaf evergreen and deciduous tree, broadleaf evergreen and deciduous tree, shrub, grass, and crop) are defined based on 1-km IGBP (International Geosphere-Biosphere Program) land cover dataset and University of Maryland tree cover dataset. • These primary types are expanded to climate regimes (arctic, boreal, temperate, and tropical), using temperature and precipitation-based rules, to obtain the 15 total PFTs. • A limitation of the current version of the CAM/CLM model is that only four PFTs for each grid cell are used. The four PFTs chosen for each grid cell are the PFTs with the highest percent coverage of area.
CLM Plant Functional Types • 0 Non-Vegetation • 1 Needleleaf Evergreen Temperate Tree • 2 Needleleaf Evergreen Boreal Tree • 3 Needleleaf Deciduous Boreal Tree • 4 Broadleaf Evergreen Tropical Tree • 5 Broadleaf Evergreen Temperate Tree • 6 Broadleaf Deciduous Tropical Tree • 7 Broadleaf Deciduous Temperate Tree • 8 Broadleaf Deciduous Boreal Tree • 9 Broadleaf Evergreen Shrub • 10 Broadleaf Deciduous Temperate Shrub • 11 Broadleaf Deciduous Boreal Shrub • 12 C3 Arctic Grass • 13 C3 Non-Arctic Grass • 14 C4 Grass • 15 Corn • 16 Wheat
Project Description • Change Amazon plant type from evergreen broadleaf trees(4) to: • Scenario 1: C3 non-arctic grass (13) • Scenario 2: Corn (15) • Change LAI (Leaf Area Index) and SAI (Stem Area Index) according to different land cover types. • Run CAM-CLM model for 7 years(1990-1996) for both control run and modified cover run. • First year is used as spin-up and rest 6 year data is averaged to monthly means. • Use Climatological SST for model run. • Energy and Water related fields from control and modified simulations are compared over annual cycle in Amazon basin.
PFT Change over Amazon Basin Control run Corn case Grass case
Interested Regions 1 Amazon basin 2 Congo basin 3 Western United States 4 Eastern United States 5 Central Europe 6 Tibetan Plateau 7 Northern Hemisphere Land 8 Southern Hemisphere Land 5 3 4 6 2 1
For grass case, LAI is decreased by 31%, surface albedo is increased by 29%; 36%, 16% respectively for corn case. • More solar radiation is reflected, increased by 35% with an extra +12W/m2 for grass case, much larger than corn case. • Downward solar radiation at surface slightly increases by 5% with an extra +11W/m2, and the net solar radiation at surface nearly does not change for grass case, but increased for corn case. • Solar absorbed by vegetation is decreased by 22% for grass and 28% for corn case, more solar is absorbed by ground, and surface air temperature is much warmer by ~1K.
For grass case, surface LW emission is increased by 10W/m2, surface downward LW is slightly increased by 2W/m2, very similar to corn case. • Surface net radiation is decreased by 6% with an extra -8.3W/m2 forgrass case, while corn case is decreased just 3%. • Since there is less vegetation, latent heat flux is decreased by 8.5%, while sensible heat flux nearly do not change for grass case; For corn case, latent heat flux decreased just 4%, and sensible heat flux decreased 2.3%. • Bowen ratio (SH/LH) is increased by 9.5% and 2.4%, respectively, due to much less latent heat flux.
For grass case, canopy evaporation is decreased by 29%, canopy transpiration is decreased by 24%, so more water goes into soil and soil evaporation is increased by 58%; while for corn case, 38%, 20%, 100%, respectively. • Surface water flux is slightly decreased by 8.5% and the total precipitation is slightly decreased by 7% for grass case, while 4% and 1% for corn case. • Convection is stronger than control case, especially for corn case. • Total runoff (as fraction of precipitation) is higher and fraction of surface runoff is also higher due to less water intercepted and evaporated by the canopy, the value for corn case is much larger.
For both grass and corn case, upper level soil moisture is slightly decreased, but lower level soil moisture doesn’t show any annual cycle change. • The lowest model layer specific humidity is decreased for both cases, while the 2-m specific humidity is decreased for grass case, but increased for corn case. • Surface runoff is slightly increased by 6% for grass case, but for corn case, it’s increased as high as 20%. • Subsurface runoff is decreased by 11% for grass case, and the corn case is similar. Big differences between control case and modified case only occur during summer season.
For grass case, liquid rain and total precipitable water are decreased, while for corn case the decrease is less than grass case. • Low cloud is decreased by 17% for grass case, and 13% for corn case. • High cloud and total cloud are decreased less than low cloud for both cases; while the corn case decreased less than grass case. • Skin temperature is increased by ~1.5K, but doesn’t show much difference between the two cases. • Surface wind speed is increased by 44% for grass case and 39%for corn case, due to the less retardation of the vegetation.
Conclusions • With less vegetation over Amazon basin, the surface albedo is increased, more solar radiation is reflected ; meanwhile, solar insolation received at ground is increased, leading to a warmer surface air temperature (increased by ~1K). Surface albedo is increased much higher for grass case. • The surface LW emission is increased while surface net radiation is decreased for both cases, but less for corn case. Sensible heat flux is decreased less than Latent heat flux. Bowen ratio is increased for both cases, but much less for corn case. • The canopy evaporation, transpiration and interception are decreased with the reduction of vegetation, more water goes down to the ground. The soil evaporation for corn case is increased much higher than grass case, nearly twice as control case.
Conclusions • With less vegetation to hold the soil water, the bottom layer becomes drier, but the precipitable water varies little. Upper layer soil moisture is silghtly decreased. Surface runoff is increased while subsurface runoff is decreased, surface runoff is much larger for corn case. • There is much less cloud in the lower atmosphere. Skin temperature is increased by ~1.5K, but doesn’t show much difference between two modified cases. Surface wind speed increases greatly due to less vegetation. • Main differences between two cases occur in summer (or boreal winter) season, this is due to the different growth period for difference plant types, in other seasons the differences are very small.