Download
1 / 27
300 likes | 560 Vues
Geothermal Short Course: Reservoir Characteristics Interpreting Temperature and Pressure Measurements from Wells. Rick Allis Utah G eological Survey Penrose Conference, Park City, UT, Oct 19-23, 2013. Themes. Conductive thermal r egimes (and heat flow)

E N D
Geothermal Short Course:Reservoir CharacteristicsInterpreting Temperature and Pressure Measurements from Wells Rick Allis Utah Geological Survey Penrose Conference, Park City, UT, Oct 19-23, 2013 Themes • Conductive thermal regimes (and heat flow) • Convective thermal regimes (interpreting geothermal well data) • Importance of water density and pressure data in hot wells • Importance of feedzone control in high permeability wells • Pressure drawdown effects due to production • High permeability effect on deep basin pressure regime • DSTs, and Injectivity Tests as indicators of permeability
Regional heat flow of the conterminous U.S. (SMU geothermal lab; Blackwell et al., 2011) Cascades Yellowstone Snake River Plain Great Basin Colorado Rockies Rio Grande rift Imperial Valley Gulf Coast Prospective reservoirs with attractive temperature and hi-permeability stratigraphic target Heat Flow Measurements – A Critical Component of Geothermal Exploration However, this map doesn’t have the resolution required for discovery of geothermal reservoirs (which require adequate temperature, and adequate permeability)
Pavant Butte- Black Rock Desert, Utah: a high heat-flow basin
Heat Flow (mW/m2) = Thermal Conductivity (W/m°C) x Temperature Gradient (°C/km) From Gwynn et al., 2013
Thermal Conductivity is important! MIT, (2006) unconsolidated basin fill, mudstone, shale sandstone, many bedrock lithologies
Heat Flow (mW/m2) = Thermal Conductivity (W/m°C) x Temperature Gradient (°C/km) Hypothetical stratigraphy H.F. = 100 mW/m2
Exploration Oil-Well Data: often the main source of data on possible geothermal potential Correcting Bottom Hole Temperatures (BHTs) for the drilling disturbance can be tricky. A variety of methods, but basically, BHTs are a noisy source of data; However, they need to be corrected, and it can be a tedious process
The Geothermal Resource • Background HF 80-85 mW/m² • = High Heat Flow Basin • High HF (>85 mW/m²) anomaly • 350 km² > 150°C at 3 km • 60 km² > 200°C at 3 km • Focused heat source superimposed on basin-scale thermal regime • Cooling intrusion? • Why is southern end of basin cooler (lower heat flow?) Oil Exploration Old Gradient New Gradient
Heat flow from Wilson and Chapman (mW/m2) The perilsof outflow plumes! (Roosevelt HS) Groundwater chemistry compiled by D. Cole
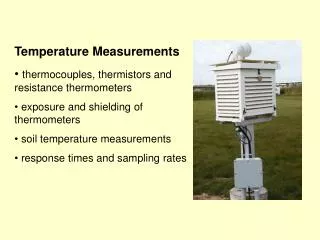
What we see in downhole temperature and pressure logs in deep exploration wells may only represent the formation conditions at a few points! • However we can still infer significant characteristics with careful detective work! Logging tool being prepared for “run”
Deep-Well Temperature and Pressure Logs • Probably the most important data to have • Temperature and permeability information is essential for understanding the reservoir (is there a thermal resource, and can you sweep the heatout!) • Logs can be “static” (i.e. shut-in); or flowing – under injection or production; sometimes this status is not recorded… • The best permeability (i.e. best “feed zone”) in the well dominates the flow regime (shut-in or flowing) – gives indication of formation pressure • May see inter-zonal flow as isothermal sections on temperature logs (sometimes difficult to decide whether flow is up or down)
Hot water is less dense than cold water: pressure profiles in wells depends on the fluid state in the well bore, which in the case below is equilibrating with the reservoir at 500 m depth (and 35 bar). Note the pressure pivot, and the difference in water “level” in the well. casing
These pressure measurements are really important for figuring out the hydrology of the system: is high permeability extensive and controlling a large reservoir? Or is the region of uniform pressure limited? The Roosevelt reservoir seemed to be over-pressured with respect to the ground surface in its natural state; it may have been in equilibrium with regional cool groundwater at about 3 km depth (10,000 ft. ) The Cove Fort reservoir is under-pressured with respect to the local groundwater, but seems to be connected to the Twin Peaks region 10 – 15 km to the north – there is a dilute warm spring in that location
Conceptual Model – Awibenkok, Indonesia(volcano-hosted) Allis, 1999
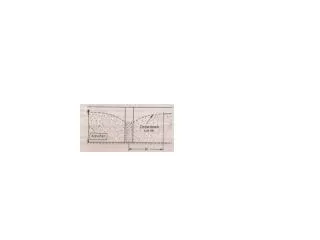
Heating 1 week P T under injection T P • Major loss zone (and rapid heat up) at 1410 m depth • Minor loss zone at 1200 m depth, and possibly minor loss zone at well bottom • Pivot in pressure curves as liquid in wellbore heats up and becomes less dense – formation pressure at 1410 m depth is 121 bar gauge • Temperature here is at least 300°C • (Possibly conductive gradient down to about 1000 m depth) • Note under injection the cool water level is at about 200 m depth (water was being poured in); however heated water column probably has +ve WHP – implying reservoir outflows as hot springs • Note also under injection, the pressure in the wellbore exceeds likely formation pressure below pivot
What would the discharging profile look like for a geothermal well? Steam zone pressure control Somewhere down here, liquid zone pressure control
Example of a discharging geothermal well Hypothetical pump
Draw down = 5 bar (50 m) What happens when we draw down a cold water well? casing reservoir Groundwater Analogy: Shape of cone of depression depends on the permeability of the aquifer (reservoir) What about a geothermal well?
Roosevelt Geothermal Field: 25 years of production, recently at 35 MWe level. About 75% of the produced mass in injected back into the reservoir. There has been pressure decline of about 35 bar (500 psi), and an increase in steaming ground activity.
Roosevelt system has developed a steam cap due to the production-induced pressure decline, and it now is an attractive target for increased power generation
Roosevelt Hot Springs – Blundell Power Plant (Pacificorp Energy) Initial Pressure Regime (hot hydrostatic) Final Pressure Regime (hot hydrostatic; but drawn down by 35 bars, or 500 psi)
Drill Stem Tests: Standard test in oil exploration drilling to detect permeability, pore fluid composition, static pressure… Example of a drill stem test from well Rocky Ridge 33-1 drilled by Python Ag LLC in 2010 (report accessed at http://oilgas.ogm.utah.gov/wellfiles/027/4302750001.pdf ). In this case the interval tested is between 6648 and 6818 feet depth, the formation pressure derived from shut-in pressures is 2810 psi (absolute), and the temperature at that depth is 195°F (91°C).
Pressure trend with depth showing normally pressured gradient (0.43 psi/foot), significant overpressures at depth, and comparison with a hot hydrostatic trend in a geothermal system with a temperature of 220°C (428°F) (modified from Nelson, 2003). Two “apparent pressure” points are shown, which can be excluded when considering the trend from the other data.
In both basins in The Rockies, high permeability and normal (hydrostatic) pressures were found in the Leadville carbonate at 5 – 7 km depth. Temperatures were in the range of 200 – 240°C at these depths. 1989 Piceance Basin, Colorado Wind River Basin, Wyoming 20 – 40 MMcf/day 68% C2H6, 20% CO2, 12% H2S Wilson et al., 1998 68% C2H6, 20% CO2, 12% H2S