Standardized Tests
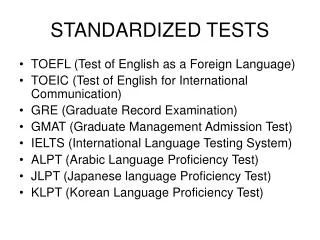
Standardized Tests. A measure of student achievement in which a student’s score is compared to a standard of performance. Norm-referenced standardized tests The student’s score is compared to the standard of the norm group scores. Wisconsin Student Assessment System: Terra Nova.

Standardized Tests
E N D
Presentation Transcript
Standardized Tests A measure of student achievement in which a student’s score is compared to a standard of performance.
Norm-referenced standardized tests The student’s score is compared to the standard of the norm group scores. Wisconsin Student Assessment System: Terra Nova Criterion-referenced standardized test The student’s score is compared to the standard of a cutoff score set by the test authors. Wisconsin Reading Comprehension Test Standards of Comparison
Test Construction Test Content • Based on a review of representative curricula and representative textbooks. Scoring • Based upon a norm sample or a pilot procedure.
Forms of Standardized Tests • Multiple choice • Writing samples • Oral question and answer • Task performance • Group standardized tests • Individual standardized tests
Test Validity Does the test measure what it claims to measure? • Content validity. Do the test items adequately reflect the skills, behaviors or content to be measured? • Concurrent validity. Is performance on one test correlated to performance on a similar well-established test that measures the same thing? • Predictive validity. Does this test predict future performance?
Test Reliability Does the test exhibit consistency? Will students likely receive similar scores with successive administrations and scorings. Will different scorers yield similar results? • Test-retest reliability • Alternate form reliability • Split-half reliability
Grade Equivalent Scores • Reported as a grade and month: 3.1, 5.6, etc. • A student’s score is equal to the raw score average of students in the norm group who took the test in the grade and month. For example, a grade equivalent of 5.6 means that the student’s raw score was the same as students in the norm group who took the test in March of fifth grade. • Does not mean that the students can read or do math at a fifth grade level. • Represents a rough and general estimate of achievement
Determining Grade Equivalents September Grade 4 Average Raw Score = 50 Score of 50 assigned GE of 4.0 April Grade 4 Average Raw Score = 64 Score of 64 assigned GE of 4.7
Interpolation There are 14 points to assign to October through March October Raw Score 51/52 = 4.1 November Raw Score 53/54 = 4.2 December Raw Score 55/56 = 4.3 January Raw Score 57/58 = 4.4 February Raw Score 59/60 = 4.5 March Raw Score 61/62 = 4.6
Extrapolation What about May and June? April Raw Score 63/64 = 4.7 May Raw Score 65/66 = 4.8 June Raw Score 67/68 = 4.9
Percentile Scores • Range from 0 to 100 with percentile scores of 15 to 84 indicating average performance. • Indicates the percentage of students in the norm group that the student did better than. • Often confused with percents. • Is a broad measure of achievement.
Stanine Scores Range from 1-9 with stanine scores of 4 to 6 indicating average performance.
Normal Curve Equivalent Scores Range from 1 to 100 with NCE scores of 30 to 70 indicating average performance.
Scale Scores • A form of a Normal Curve Equivalent Score • Are numbers less than 1,000 with raw scores from lower grade level (e.g., 1.2) associated with lower scale scores (e.g.,109) and raw scores from higher grade levels (e.g., 11.7) associated with higher scale scores (e.g., 722) • Allows computation of gains on the part of a student across different test levels but within the same edition of a test.
Proficiency Levels Broad categories assigned to scores: minimal, basic, proficient, advanced.
What Contributes to A Student’s Score? • Knowledge and/or skill level • Content knowledge • Reading ability • Student test-taking skills • Student understanding of directions More on next slide!
What Contributes to A Student’s Score? • Student motivation • Student physical well-being • Student mental well-being • Curricular coverage in the school • Teacher effectiveness • Parental aspiration/pressure