Download
1 / 14
140 likes | 272 Vues
ICHEP Meeting, August 17 - August 22, 2004. W Helicity Measurement in Top Quark Decays at D Ø. Ariel Schwartzman Princeton University On behalf of the D Ø Collaboration. OUTLINE: Introduction: Top Quark Production and Decay at the Tevatron. Measurement of the W Helicity . Outlook.

E N D
ICHEP Meeting, August 17 - August 22, 2004 W Helicity Measurement in Top Quark Decays at DØ Ariel Schwartzman Princeton University On behalf of the DØ Collaboration • OUTLINE: • Introduction: Top Quark Production and Decay at the Tevatron. • Measurement of the W Helicity. • Outlook.
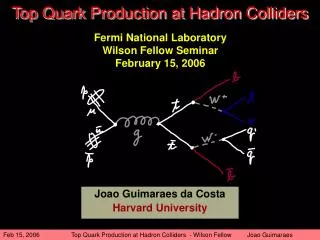
Top Quark Production and Decay Large mt probes physics at much higher energies than other fermions. mt>mW, the W polarization in top decays is very different from that of other weak decays. W helicity measurement is a test of the SM and an opportunity to look for new physics. • Since |Vtb| ~ 1, the top quark almost always decays to Wb. • Event topology depends on the W decay mode: • Dilepton: 2 high pT leptons, 2 b-jets, large ETmis. BR(ee, μμ, eμ) = 5%. • Lepton + Jets: 1 high pT lepton, 4jets (2 b-jets), large ETmis. BR(e,μ) = 30%. • All hadronic: 6 high pT jets (2 b-jets). BR = 44%. At the Tevatron √s = 1.96 GeV, top quarks are primarily produced in pairs qq annihilation (85%) Select Lepton+Jets channel for W helicity measurement. gluon fusion (15%)
Weak Interaction of the Top Quark V-A charged-current weak interaction: • The nature of the tbW vertex have not yet been studied accurately. • Sensitive to anomalous (non-SM) couplings. b t W+ • In the SM,top quarks decay as left-handed fermions through the V-A weak interaction. • In the limit of massless b quark, the V-A coupling at the tbW vertex requires that the b quark in top decays is produced left handed. • Angular momentum conservation only allows left-handed and longitudinal W helicity configurations. b W (0) (-1/2) t (+1/2) t (+1/2) (+1) (+1/2) W b Top quark rest frame
Polarized W Boson Decay b W+ θ W boson rest frame l+ • The angular distribution of the helicity states of the W boson is described by the angle between the lepton and the original W momentum in the W rest frame. A measurement of the W helicity probes the underlying weak interaction of the top decay. Observation of a V+A charged-current interaction would indicate physics beyond the SM. • Previous Run 1 measurements: • CDF: f0 = 0.91 ± 0.50 (stat+syst), f+=0.11 ± 0.15 (stat) • DØ: f0 = 0.56 ± 0.38 (stat +syst) We want to measure f+.
Outline of the Analysis • Two separate analyses: • Topological • b-tagging. • Event selection. • Lepton plus jets kinematic pre-selection: • W+jets. • tt. • Multi-jets. • b quark-jet tagging. • Top quark identification: • Topological likelihood separate top quark from W+jets. • Kinematic constraint fit reconstruct four-vectors of final state particles. • Measure cos(θ) for each selected event. • Compare the measured distribution of cos(θ) to its expectation from background and signal templates with different V+A fractions (f0 is fixed at its SM value). • Determine the most likely value of f+: • Binned likelihood fit to cos(θ) distribution. • Confidence interval for f+. • Integrated Luminosity: • e+jets: 168.7 pb-1. • μ+jets 158.4 pb-1.
The DØ Detector • Tracking: • Silicon and Fiber tracker. • 2T magnetic field. • Central and Forward pre-shower. • Calorimeter: • New electronics. • Muon detector: • 1.8 T Toroid. • || < 2. t b
Event Pre-Selection • Kinematics Selection: • 1 isolated e, pT>20GeV, ||<1.1 or 1 isolated μ, pT>20 GeV, ||<2.0. • Missing transverse energy (ETmis)>20 GeV. • 4 or more jets, pT>15 GeV, ||<2.5. • b-tag analysis: • 1 b-tagged jet. (Secondary Vertex Algorithm) • Find track-jets • Find secondary vertices within jets. • Select significantly displaced vertices
Topological Selection • Both analyses use a 6-variable topological likelihood to discriminate tt from W+jets events. • Top quark events are more spherically and centrally produced and have larger transverse energy than W+jets. • Optimized to maximize the statistical significance between V+A and V-A decays. • Likelihood cut efficiency is almost independent of f+.
Signal and Background Discrimination • The number of multi-jet events is determined by making use of the different rate (with respect to W+jets or tt) to fake leptons. • The number of tt and W+jets events is extracted by making use of the likelihood discriminant distribution: • By performing a fit (b-tag analysis) • By performing a cut and using the cut efficiency determined in Monte Carlo (Topological analysis). b-tag selection: L>0.1 (μ) L>0.3 (e) (μ+jets) b-tag Topological selection: L>0.6
Cos(θ) Templates • Kinematic constraint fit: • Reconstruct four vectors of all particles. Minimize 2 defined as: • m(jj) = m(l) = mW = 80.4GeV. • m(jjl) = m(lj) = mt = 175.0GeV. • 12 possible jet-parton assignments Choose solution with lowest 2. • Signal cos(θ)templates: • f+= 0.0 .. 0.3 (maximum possible value) in steps of 0.05. • f0 fixed at 0.7. • Background templates: • W+jets (from Monte Carlo). • Multijets (from data, with reversed isolation criteria for leptons)
W Helicity Measurement b-tag Topological f+ is extracted by means of a binned Poisson maximum likelihood fit using the decay angle templates for Multi-jets, W+jets, and the signal templates. The likelihood is built by multiplying the Poisson probabilities of each template bin, for each value of f+.
Results and Limit Calculation • Determine a confidence interval with 90% confidence level for f+ using a Bayesian technique. • Find upper limit with 90% C.L. since the minimum of –ln(L) lies outside the physically-allowed range. Prior: b-tag Topological Central value: f+ = -0.13 ± 0.23 (stat) f+ < 0.24 (90% C.L.) including syst. Central value: f+ = -0.11 ± 0.19 (stat) f+ < 0.24 (90% C.L.) including syst.
Systematic Uncertainties b-tag Topological Factor of ~1.5-2 smaller than statistical errors. • Systematic uncertainties are incorporated in the limit calculation by convoluting a Gaussian function –of width given by the total systematic uncertainty- with the likelihood. • The magnitude of each systematic uncertainty is estimated by running ensemble tests: • Create toy experiments with modified templates. • Likelihood fit using standard templates. • Observe shift in the maximum of the likelihood.
Summary • First DØ Measurement of the V+A component in the tbW vertex using topological and lifetime b-tagging techniques. • Analysis based on the decay angle between the lepton and the direction of the top quark in the W boson rest frame. f+ < 0.24 (90% C.L.) Topological. f+ < 0.24 (90% C.L.) b-tag. • Preliminary results are in agreement with the SM prediction. • Two analyses will be combined into a single result. • Set the ground for more precise measurement: Expect improvements from larger data sample (~0.5 fb-1 by the end of 2004) and by the use of more sophisticated techniques being developed. Results including systematic uncertainties.