Download
1 / 38
380 likes | 490 Vues
This report summarizes findings from the 2010 National Survey of Syringe Exchange Programs, focusing on program characteristics, budget trends, syringe distribution, participant demographics, and operational details.

E N D
2010 National Survey of Syringe Exchange Programs: Summary of Results Don C. Des Jarlais, Vivian Guardino, Ann Nugent, KamyarArasteh, David Purchase This work was funded by amfAR, The Foundation for AIDS Research, with support from the Elton John AIDS Foundation and the Irene Diamond Foundation-Tides Foundation.
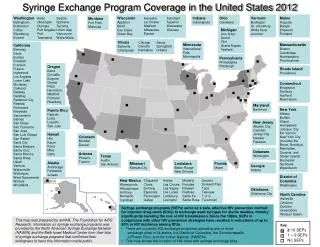
Characteristics of SEPs Participating in BIMC/NASEN SurveysUnited States, 1994-2010 * This category includes the District of Columbia and/or Puerto Rico.
Number of syringes exchanged and Total SEP budgets 1994-2010 *adjusted using a constant 3% annual inflation rate
National Survey of Syringe Exchange Programs Methodology 2009 Survey • 201 SEPs contacted in first quarter 2010 • 149 SEPs (74%) submitted completed surveys by early summer. 2010 Survey • 194 SEPs contacted in first quarter 2010 • 149 SEPs (77%) submitted completed surveys by early summer.
SEPs That Participated in 2009 & 2010 SurveysTotal Budget $$ 2009 $20,045,912 (as reported by 115 SEPs) 2010 $18,889,998 (as reported by 115 SEPs)
Gender Distribution of NSEP Participants in 2010* *Weighted by the number of syringes distributed
Ethnic Distribution of NSEP Participants in 2010* *Weighted by the number of syringes distributed
Weekly Exchange Hours @ Regular, Scheduled Times & Places • 2009 Total of 4,063 hours per week averaging 27.8 hours per SEP (n = 146) • 2010 Total of 4,370 hours per week averaging 30.8 hours per SEP (n=142)
Number of Syringes Distributed by Syringe Exchange Programs (SEPs), by Program Size: 2009 & 2010 * In 2009, one program responding to the survey did not track the number of syringes exchanged, in 2010 nine programs did not indicate the number of syringes they distributed.
2009 (n=117*) 33,178,581 syringes distributed 26,953,212 syringes collected 2010 (n=117*) 32,650,380 syringes distributed 27,114,420 syringes collected Syringes Exchanged By Programs ThatParticipated in Both 2009 & 2010 Surveys *Only programs which reported the number of syringes distributed in both 2009 and 2010 are included in the calculations above . In 2009, five programs in this group did not report the number of syringes they collected , the number was seven in 2010.
SEP Usage of Unique Identifiers for Tracking Individuals in 2010
Secondary Exchange & Methods of Encouragement Used by SEPs in 2010
Weekly On-Site Medical Services • 2009 Total of 1,360 hours per week, averaging 29.6 hours per SEP offering on-site medical services (n=46) • 2010 Total of 1,089 hours per week, averaging 16.8 hours per SEP offering on-site medical services (n=65)
Overdose Rescue & Drug Treatment Medications Provided by SEPs in 2009 & 2010
HIV and Hepatitis Related On-Site Services Provided by SEPs in 2009 & 2010
Screening Related On-Site Services Provided by SEPs in 2009 & 2010
Quality of Relationship Between SEPs and Police as Reported by SEPs in 2009 & 2010
Quality of Relationship Between SEPs and Local Health Officials as Reported by SEPs in 2009 & 2010
Strategies SEPs Used in 2010 to Gain Law Enforcement Support
Any favorable or unfavorable media attention in 2010 • YES • 37 programs (25%) • NO • 110 programs (75%)