
Price Elasticity: Economist Insights & Practical Applications
E N D
Presentation Transcript
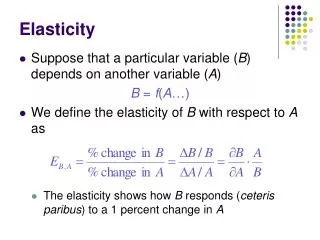
Elasticity Today: Thinking like an economist requires us to know how quantities change in response to price
Today • Elasticity • Calculated by the percentage change in quantity divided by the percentage change in price • Denominator could be something else, but for now think price
Elasticity • Elasticity is most commonly associated with demand • Percentage changes are typically small when calculating elasticity • Note elasticity is negative, since price and quantity move in opposite directions • We will typically ignore negative sign
Elasticity • Demand elasticity falls into three broad categories • Elastic, if elasticity is greater than 1 • Unit elastic, if elasticity is equal to 1 • Inelastic, if elasticity is less than 1
Economist questions of the day • How can you maximize the total ticket expenditures on the Santa Barbara Foresters? • What happens to total expenditures spent on strawberries (or total revenue received by firms) when growing conditions are good?
Inelastic demand • When demand is inelastic, quantity demanded changes less than price does (in percentage terms) • What goods are unresponsive to price? • Salt • Illegal Drugs? • Coffee
Salt, illegal drugs, and coffee • Why are these goods price inelastic? • Some determinants of price elasticity of demand • Availability of good substitutes • Fraction of budget necessary to buy the item • Age of currently-owned item when considering replacement, if a durable good
Salt, illegal drugs, and coffee • These items do not have good substitutes • Salt Potassium chloride • Illegal drugs Legal drugs? • Coffee Tea, “energy” drinks
Caution • Some economists use the reference point in calculating percentage changes to be the initial price • Other economists use the average of the two prices involved (see Appendix, Chapter 4) • In this class, you can use either method • I will use the initial price
Example • Suppose the price of apples falls from $1.00/lb. to $0.90/lb. • This causes the number of apples consumed in Santa Barbara to increase from 2 tons/day to 2.1 tons/day • What is the price elasticity of apples at this point?
Example • %ΔQ • %ΔP • We will ignore the negative on %ΔP
Example • The demand elasticity of apples in Santa Barbara is thus 0.05/0.1 = 0.5 • The demand of apples is inelastic
Algebra lesson for straight-line demand curves • Slope on straight line is ΔP/ΔQ • Along a straight line, elasticity is also equal to P/Q times inverse of the slope (see above)
Why is studying elasticity important? • Suppose that you work for the Santa Barbara Foresters, the local amateur baseball team • Suppose that in a previous season, a UCSB student studied demand and elasticity of demand for tickets • You are asked to use this information to maximize ticket expenditures
Some information lost • The student from the previous season only provided the following information • Demand for tickets is nearly linear • A table of estimated elasticity at various prices • You are asked to price tickets to maximize expenditure
How do we solve this? • We need two additional pieces of information • When demand is linear, total expenditure is maximized at the midpoint of the demand curve • We can prove that price elasticity is 1 at the midpoint of the demand curve • Solution: Find the point with price elasticity is 1
Solution: Find price elasticity of 1 • Answer: Price each ticket at $5 • Is this table consistent with a linear demand curve? • Yes Try P = 10 - Q
Some other important elasticity facts • On a linear demand curve • Elasticity is greater than 1 on the upper half of the curve • Elasticity is less than 1 on the lower half of the curve • Exceptions • Horizontal demand: Elasticity is always ∞ • Vertical demand: Elasticity is always 0
Back to increasing expenditure • This is an example of being able to control price (more on this while studying monopoly) • When you can control price and you want to increase expenditure, go in the direction of the highest change • When demand is elastic, %ΔQ is higher than %ΔP Decrease P to increase expenditures • Inelastic demand, the opposite occurs Increase P to increase expenditures
Back to our bumper crop of strawberries • Under normal growing conditions, suppose that S1 is the supply curve • In the bumper crop season, supply shifts out to S2 • What happens to total expenditure?
Back to our bumper crop of strawberries • ε = 0.29 inelastic • Expenditure goes DOWN moving from S1 to S2 • The bumper crop of strawberries actually hurts farmers collectively • Normal growing conditions: Total expenditure is $56 million • However, look at elasticity (note slope is 1): • ε = P/(Q slope) • ε = 0.29 inelastic
What is happening here? • The price drops by 50%, while the % increase in strawberries is small • Price change dominates • Assuming costs are the same in both years, farmers will make less profit in the bumper crop year
Elasticity of supply • Supply has elasticity, too • Most of the math is the same or similar to what we have talked about with demand
Summary • Elasticity tells us what happens to total expenditure along the demand curve • On a straight line demand curve, total expenditure is maximized halfway between the vertical intercept and horizontal intercept • Supply shift to the right does not necessarily increase total expenditure