Investigating Stratospheric Dynamics and Water Vapor Anomalies via KODYACS Project
10 likes | 127 Vues
The KODYACS project aims to explore the coupling of dynamics, chemistry, and physical processes in the upper troposphere/lower stratosphere and middle atmosphere. This research utilizes atmospheric models and multi-year satellite and ground-based observations. Key questions include how stratospheric processes influence tropospheric variability, the transport of air masses through the tropopause, and trends in chemical compounds that impact climate change. The findings will enhance our understanding of atmospheric dynamics and contribute to better climate predictions.

Investigating Stratospheric Dynamics and Water Vapor Anomalies via KODYACS Project
E N D
Presentation Transcript
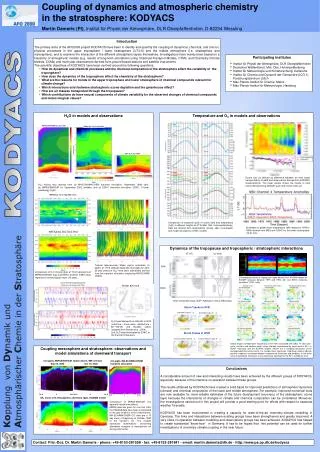
MA-ECHAM4/CHEM H2O, Sep 1998 MIPAS H2O, 18.-27. Sep 2002 E39/C H2O, Sep “2000” Anomalies of global mean temperature (with respect to 1979 to 1990) derived from MSU and E39/C for the lower stratosphere (13-21 km). E39/C H2O, Sep (clim. mean), 15 km Tropical tape-recorder: Water vapour anomalies (in ppmv) at 1,9°S (altitude dependent averages for each 20-year period of H2O have been subtracted) derived from the transient simulation employing MA-ECHAM/ CHEM. Climatological values of tropopause height derived from KASIMA (based on ECMWF analyses between 1979 and 1993; left) and E39/C (timeslice simulation “1990”; right). H2O trend derived from HALOE at 40°N (solid line = zonal mean, dashed line = 80°-130°W) and Boulder station (adopted from Randel et al., 2004). Left: H2O trend calculated by E39/C at the thermal tropopause. Global maps of temperature fluctuations at 400 hPa associated with QBO, 11-year solar-cycle, northern and southern polar vortex strength (represented by zonal wind at 60°), in NCEP reanalysis and the ECHAM models. Shown are 2 standard deviations of the corresponding time series terms in a multiple linear regression. Red (blue) colours indicate positive (negative) correlation between temperature fluctuation and predictor. In the white areas the predictor (influence) is not statistically significant at the 90% confidence level. CO (ppm), MIPAS/ENVISAT observations, IMK retrieval CO (ppb), MA-ECHAM4/CHEM transient simulation Sep 20, 2002 Oct 13, 2002 80°S 0° 80°N 80°S 0° 80°N 80°S 0° 80°N SF6 tracer with mesospheric chemistry (ppt), KASIMA model Coupling of dynamics and atmospheric chemistry in the stratosphere: KODYACS Martin Dameris (PI),Institut für Physik der Atmosphäre, DLR Oberpfaffenhofen, D-82234 Wessling • Introduction • The primary aims of the AFO2000 project KODYACS have been to identify and quantify the coupling of dynamical, chemical, and (micro-) physical processes in the upper troposphere / lower stratosphere (UT/LS) and the middle atmosphere (i.e. stratosphere and mesosphere), and to examine the interaction of the different atmospheric layers themselves. Investigations have mainly been based on a hierarchy of atmospheric models (e.g. results of long-term simulations using Chemical-Transport Models, CTMs, and Chemistry-Climate Models, CCMs) and multi-year observations derived from ground based stations and satellite instruments. • The scientific objectives of KODYACS have been centred around the following questions: • How do dynamical and chemical processes and the chemical composition of the stratosphere affect the variability of the • troposphere? • How does the dynamics of the troposphere effect the chemistry of the stratosphere? • What are the reasons for trends in the upper troposphere and lower stratosphere of chemical compounds relevant for • climate change? • Which interactions exist between stratospheric ozone depletion and the greenhouse effect? • How are air masses transported through the tropopause? • Which contributions do have natural components of climate variability for the observed changes of chemical compounds • and meteorological values? • Participating institutes • Institut für Physik der Atmosphäre, DLR Oberpfaffenhofen • Deutscher Wetterdienst, Met. Obs. Hohenpeißenberg • Institut für Meteorologie und Klimaforschung, Karlsruhe • Institut für Chemie und Dynamik der Geosphäre (ICG-1), • Forschungszentrum Jülich • Max-Planck-Institut für Chemie, Mainz • Max-Planck-Institut für Meteorologie, Hamburg H2O in models and observations Temperature and O3 in models and observations Ozone loss as defined as difference between an inert tracer transported by CLaMS and observations derived from ENVISAT measurements. The lower panels shows the results in total ozone distinguishing between pure and mixed vortex air. H2O mixing ratio derived from (a) MA-ECHAM4/CHEM transient simulation, September 1998 (left), (b) MIPAS/ENVISAT for September 2002 (middle), and (c) E39/C time-slice simulation “2000”, 10-year climatology (right). Comparison of seasonal cycle of ozone (left) and temperature (right) in different heights at 47°N (Met. Obs. Hohenpeißenberg). Data are derived from observations (sonde, lidar, re-analyses) and model simulations (CTMs, CCMs). Dynamics of the tropopause and tropospheric / stratospheric interactions Comparison of H2O mixing ratios at 15 km derived from MIPAS/ENVISAT (top) and E39/C (bottom). E39/C data represent a climatological mean (10-year). Coupling mesosphere and stratosphere: observations and model simulations of downward transport Conclusions A considerable amount of new and interesting results have been achieved by the different groups of KODYACS, especially because of the intensive co-operation between these groups. The results obtained by KODYACS have created a solid basis for improved predictions of atmospheric dynamics (climate) and chemical composition of the lower and middle atmosphere. For example, improved numerical tools are now available for more reliable estimates of the future development (recovery) of the stratospheric ozone layer because the interactions of changes in climate and chemical composition can be considered. Moreover, the investigations carried out in this project will provide a good starting point for efforts with respect to seasonal weather forecasts. KODYACS has been instrumental in creating a capacity for state-of-the-art chemistry-climate modelling in Germany. The links and interactions between existing groups have been strengthened and greatly improved. A very close co-operation between modelling and observations groups has been achieved. KODAYCS has helped to create substantial “know-how” in Germany. It has to be hoped that this potential can be used for further investigations of chemistry-climate coupling in the near future. Comparison of MIPAS/ENVISAT CO data with model simulations: MIPAS-data are given for one half orbit, the KASIMA data have been interpolated to the geo-locations of the observations, MA-ECHAM4/CHEM CO data are a 10 day mean of beginning of October 1997 of the transient run. The models reproduce observations concerning downward transport of mesospheric air during polar winter. Contact: Priv.-Doz. Dr. Martin Dameris - phone: +49-8153-281558 - fax: +49-8153-281841 - email: martin.dameris@dlr.de - http://www.pa.op.dlr.de/kodyacs


![[SO 2 + H 2 O H 2 SO 3 ] SO 3 + H 2 O H 2 SO 4 CO 2 +H 2 O H 2 CO 3](https://cdn2.slideserve.com/4275035/slide1-dt.jpg)