HYMN
HYMN Hydrogen, Methane and Nitrous oxide: Trend variability, budgets and interactions with the biosphere GOCE-CT-2006-037048. TM4 Year 2004 and sensitivity runs; first comparisons with FTIR and SCIAMACHY Michiel van Weele HYMN meeting, Paris, April 2008. TM4 base run 2004

HYMN
E N D
Presentation Transcript
HYMN Hydrogen, Methane and Nitrous oxide:Trend variability, budgets and interactions with the biosphere GOCE-CT-2006-037048 TM4 Year 2004 and sensitivity runs; first comparisons with FTIR and SCIAMACHY Michiel van Weele HYMN meeting, Paris, April 2008
TM4 base run 2004 TM4 sensitivity runs N2O emissions, budget and uncertainties First comparisons to FTIR First comparisons to SCIAMACHY Overview
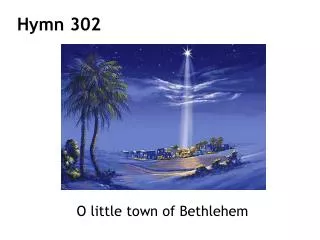
Resolution: (lon x lat) 3 x2 degrees; 25 layers in vertical General characteristics: Emissions (Bousquet a-posteriori) 534 Tg/a CH4 burden 4873 Tg Loss via tropospheric OH 479 Tg/a Loss in stratosphere 41 Tg/a CH4 soil sink 25 Tg/a CH4 trend -11 Tg/a CH4 lifetime 4873 / 545 8.9 yrs CO emissions (511+405+180) 1096 Tg CO burden 360 Tg CO+OH 2273 Tg/a CO lifetime 360 / 2273 ~2 mnd Relative contributions OH loss: OH + CO 40% OH + HO2 5% OH + CH4 16% OH + Isoprene 4% OH + NMHC 14% OH + H2O2 4% OH + HCHO 6% OH + Other 6% OH + H2 5% Feedbacks of CH4 lifetime on CH4 dominated by changes in CO Trend anthropogenic CO (Asia) (2000:542 and 2004:511)? Interannual variability biomass burning CO TM4 base run 2004 Monthly-mean surface CH4
Goal: Reproduce with TM4 effects of latitudinal shifts in CO, NOX and CH4 emissions on CH4 lifetime (Gupta et al., 1997): What if the emission growth over last decade had taken place in the extratropical NH instead of (sub-)tropics ? Three runs are performed for 2004: S1) 10% CO + NOX emissions shifted from tropics to NH S2) 10% CO emissions shifted from tropics to NH S3) 10% CH4 emissions shifted from tropics to NH Emissions are redistributed between [ 34S – 34N ] and [ 34N – 90N ] Three month spin-up; same startfield => Changes in CH4 lifetime and CH4 interhemispheric gradient TM4 sensitivity runs 2004
TM4 sensitivity runs 2004 • decrease in CH4 lifetime by a shift in NOx emissions ~ 0.7% per 1 TgN Historic anthropogenic NOx non-OECD countries from RETRO 1980-2000: • from ~12.3 (1980) to 17.3 TgN (2000): +40% or ~5 TgN • 5 X 0.7 = 3.5% reduced CH4 lifetime accommodates ~ 20Tg CH4 emissions increase • only from shift; not-yet included the global increase in NOX emissions
Effect of the latitudinal shift in CH4 emissions on theinterhemispheric gradient solid line Base run Dotted line NH shifted CH4 Plus signs NOAA/GMD monthly means for Alert and South Pole • A shift of 26 Tg CH4 from (sub-)tropics to NH increases the annual-mean • CH4 interhemispheric gradient from 120 to 138 ppb. NOAA/GMD: 129 ppb. • The gradient is increasing over the year => multi-annual runs needed
Current runs use Bousquet a-posteriori CH4 emissions (left) and soil sink Next run with: - LPJ-base wetland distribution and soil sink - IIASA-scaled anthropogenic CH4 (etc) emissions (right) - other minor natural emissions (ocean/geologic/…) Sensitivity runs Other ratio LPJ wetland emissions over tropics and extra-tropics Other ratio LPJ global wetland emissions and anthropogenic emissions TM4 sensitivity runs 2004 (as planned) HYMN anthrop; IIASA- scaled LPJ: * global wetlands * soil sink Other natural CH4 emissions
N2O budget and uncertainties IIASA, year 2000: non-energy-related 6.6 energy-related 0.5 Total (Tg N2O-N/yr) 7.1 Budget equations: N = s X0pre-industrial A + N = s X1 + T present-day N = Net natural fluxes A = Anthropogenic emissions s = stratospheric loss rate Burden ratio X1 / X0 (~ 315 / 270) IPCC 4AR, year 2000: Anthropogenic 6.7 Natural source 11.0 Trend (+1 ppb/yr) 5.0 Total (Tg N2O-N/yr) 17.7 N = (A – T) / (X1/X0 -1) N ~6*( A – T ) GEIA (1990s) energy-related 0.7 Animals, waste 1.1 BMB, biofuel 0.2 Soils* 7.9 Ocean 3.6 Total (Tg N2O-N/yr) 13.5 * post-forest clearing soils, soils under natural vegetation, fertilised agricultural fields HYMN year 2000 budget and uncertainties Anthropogenic source 6.8 +/- 0.5 Trend (+1 ppb/yr) 5.0 +/- 0.7 Net natural flux 10.8 +/- 3.1 Oceans 3.8 Soils nat. vegetation 7.0 Total (Tg N2O-N/yr) 17.6 +/- 3.2 Implied stratospheric sink 12.6 +/- 3.2
First comparisons CTMs vs FTIR CH4 (Reunion) Green LSCE Dark blue OSLO Light blue KNMI Solid line 3 micro-windows Dashed line 5 micro-windows
First comparisons CTMs vs FTIR CH4 (Jungfraujoch) Green LSCE Dark blue OSLO Light blue KNMI Solid line ‘standard approach’ Dashed line ‘alternative approach’
2004 Comparison TM4 vs SCIAMACHY CO (locations) Europe(above) BMB Africa (down) US outflow(above) East-Asia (down)
Preliminary methane data for HYMN project by Rita Wania, 11 Mar 2008 “The data are decadal monthly means from 1991-2000. Annual monthly values will be provided soon. They are gridded on a 1x1deg resolution. The values are monthly mean fluxes of methane in g CH4-C m-2 month-1for the CRU and the ECHAM5 runs. The ECHAM5 data are from the IPCC20th century runs (# 1) and corrected by the CRU climatology. I ran LPJ-WHyMe for all of the organic grid cells according to the ISRIC-WISE organic soil carbon map (version 1.0). Because this is an overestimation of the area, I overlaid Matthews and Fung's wetland mask on top of that and then scaled the fluxes by the fraction of inundation. This means that you can now calculate fluxes per grid cell just by multiplying each cell by its area. The results you get are 36Tg CH4-C/yr for the CRU data and 55 Tg CH4-C/yr for the ECHAM5 data. Don't ask me why I've got such a big difference between the CRU and the ECHAM5 data, despite the anomaly correction. I don't quite know. I saw that the amplitude of temperatures is bigger in ECHAM5, but I haven't had time yet to explore this discrepancy any further.” Notes