Download
1 / 33
330 likes | 488 Vues
The U.S. genetic evaluation system. U.S. dairy population and milk yield. U.S. DHI dairy statistics (2011). 9.1 million U.S. cows ~75% bred AI 47% milk recorded through Dairy Herd Information (DHI) 4.4 million cows 86% Holstein 8% crossbred 5% Jersey

E N D
U.S. DHI dairy statistics (2011) • 9.1 million U.S. cows • ~75% bred AI • 47% milk recorded through Dairy Herd Information (DHI) • 4.4 million cows • 86% Holstein • 8% crossbred • 5% Jersey • <1% Ayrshire, Brown Swiss, Guernsey, Milking Shorthorn, Red & White • 20,000 herds • 220 cows/herd • 10,300 kg/cow
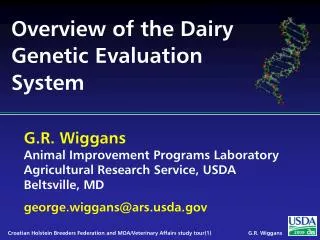
Dairy genetic evaluation program PDCA DHI NAAB AIPL CDCB Universities AIPL Animal Improvement Programs Lab., USDA CDCB Council on Dairy Cattle Breeding DHI Dairy Herd Information (milk recording organizations) NAAB National Association of Animal Breeders (AI) PDCA Purebred Dairy Cattle Association (breed registries)
Traditional data flow milk samples Milk testing laboratory DHI herd registered pedigree data test-day data component percentage somatic cell score management reports registered pedigree data Dairy records processing center Breed association lactation records AIPL genetic evaluations registered pedigree data grade pedigree data, genetic evaluations test-day data, pedigree data, breeding data bull status AI organization genetic evaluations
Animal model • 1989 – present • Introduced by George Wiggans and Paul VanRaden • Advantages • Information from all relatives • Adjustment for genetic merit of mates • Uniform procedures for males and females • Best prediction (BLUP) • Crossbreds included (2007)
Dairy cattle traits evaluated by USDA 1Sire calving ease evaluated by Iowa State University (1978–99) 2Estimated relative conception rate evaluated by DRMS@Raleigh (1986–2005)
Evaluation methods for traits • Animal model (linear) • Yield (milk, fat, protein) • Type (Ayrshire, Brown Swiss, Guernsey, Jersey) • Productive life • Somatic cell score • Daughter pregnancy rate Heritability 25– 40% 7– 54% 8.5% 12% 4% • Sire – maternal grandsire model (threshold) • Service sire calving ease • Daughter calving ease • Service sire stillbirth rate • Daughter stillbirth rate 8.6% 3.6% 3.0% 6.5%
Type traits • Stature • Strength • Body depth • Dairy form • Rump angle • Thurl width • Rear legs (side) • Rear legs (rear) • Foot angle • Feet and legs score • Fore udder attachment • Rear udder height • Rear udder width • Udder cleft • Udder depth • Front teat placement • Rear teat placement • Teat length
Genetic trend – Holstein milk Phenotypic base = 11,828 kg 79 kg/yr Cows Sires
Genetic trend – Holstein fat Phenotypic base = 432 kg 2.7 kg/yr Cows Sires
Genetic trend – Holstein protein Phenotypic base = 356 kg 2.6 kg/yr Cows Sires
Genetic trend – Holstein productive life Phenotypic base = 27.2 mo 0.2 mo/yr Cows Sires
Genetic trend – Holstein somatic cell score Phenotypic base = 3.0 Cows 0.02/yr Sires
Genetic trend – Holstein daughter pregnancy rate 0.1%/yr Cows Sires Phenotypic base = 22.6%
Genetic trend – Holstein calving ease 0.18%/yr Daughter Service-sire phenotypic base = 7.9% 0.01%/yr Daughter phenotypic base = 7.5% Service sire
Genetic trend – Holstein stillbirth rate 0.10%/yr Service-sire phenotypic base = 8.1% Daughter 0.04%/yr Daughter phenotypic base = 7.3% Service sire
Traditional evaluation summary • Evaluation procedures have improved • Fitness traits have been added • Effective selection has produced substantial annual genetic improvement • Indexes enable selection for overall economic merit • Fertility evaluations prevent continued decline • USDA serves the dairy industry with reliable evaluations and research to improve procedures
Genomic evaluation system • Provides timely evaluations of young bulls for purchasing decisions • Increases accuracy of evaluations of bull dams • Assists in selection of service sires, particularly for low-reliability traits • High demand for semen from genomically evaluated 2-year-old bulls
Genomic data flow DHI herd DNA samples DNA samples genomic evaluations DNA samples DNA laboratory AI organization, breed association genotypes AIPL nominations, pedigree data genotype quality reports genomic evaluations genotypes
Illumina genotyping arrays BovineSNP50 54,001 SNPs (version 1) 54,609 SNPs (version 2) 45,187 SNPs used in evaluation BovineHD 777,962 SNPs Only BovineSNP50 SNPs used >1,700 SNPs in database BovineLD 6,909 SNPs Allows for additional SNPs BovineSNP50 v2 BovineHD BovineLD
Genotyped Holsteins *Traditional evaluation **No traditional evaluation
Calculation of genomic evaluations • Deregressed values derived from traditional evaluations of predictor animals • Random allele substitution effects estimated for 45,187 SNP (Bayes A) • A polygenic effect accounts for genetic variation not explained by SNP • Selection index combines genomic and traditional information not included in genomic • Applied to yield, fitness, calving, and type traits
Holstein prediction accuracy a PL=productive life,CE = calving ease and SB = stillbirth. b 2011 deregressed value – 2007 genomic evaluation.
Reliabilities for young Holsteins* 9000 50K genotypes 8000 3K genotypes 7000 6000 5000 Number of animals 4000 3000 2000 1000 0 40 45 50 55 60 65 70 75 80 Reliability for PTA protein (%) *Animals with no traditional PTA in April 2011
Life cycle of bull Parents selected Dam inseminated • Embryo • transferred • to recipient • Bull born • Genomic test Semen collected (1 yr old) Daughters born (9 mo later) Daughters calve (2 yr later) Bull receives progeny test (5 yr old)
Benefits of genomics Determine value of bull at birth Increase accuracy of selection Reduce generation interval Increase selection intensity Increase rate of genetic gain
Genomic evaluation summary • Extraordinarily rapid implementation of genomic evaluations • Chips provide genotypes of high accuracy • Comprehensive checking insures quality of genotypes stored • Young-bull acquisition and marketing now based on genomic evaluations • Genotyping of many females because of lower cost low-density chips