Reliability Analysis of Anti-lock Braking Systems Using SPN and SAN Models
This project presents a detailed reliability analysis of Anti-lock Braking Systems (ABS) through Stochastic Petri Net (SPN) and Stochastic Activity Network (SAN) models. We provide insights into the modeling process, including identification of assumptions, graphically represented findings, and semi-validation through comparative analysis. The models assess various levels of failure severity, highlighting degraded mode, loss of stability (LOS), and loss of vehicle (LOV). The impact of coincident failures on reliability is analyzed, and results suggest significant differences in reliability predictions between SPN and SAN methodologies.

Reliability Analysis of Anti-lock Braking Systems Using SPN and SAN Models
E N D
Presentation Transcript
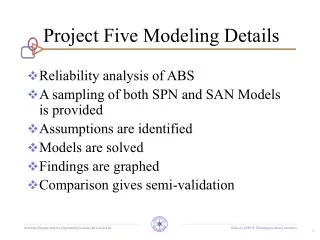
Project Five Modeling Details • Reliability analysis of ABS • A sampling of both SPN and SAN Models is provided • Assumptions are identified • Models are solved • Findings are graphed • Comparison gives semi-validation
Assumptions Exponential Failure Rates to allow Markov chain analysis Levels of failure severity: degraded mode, loss of stability (LOS) and loss of vehicle (LOV) Impact of failure on failure rates: Degraded – two orders of magnitude LOS – four orders of magnitude Limited number of inter-dependencies modeled Inter-dependencies b/w components SPN Models Representing Severity and Coincident Failures (1)
All ABS components represented in the global model. Components grouped according to their cardinality. degraded_operation, loss_of_stability and loss_of_vehicle places model severity of failure. Next slide shows controller detail… The SPN Model for ABS SPN Models Representing Severity and Coincident Failures (2)
Every component either functions “normally” as shown by controllerOp or “fails” as shown by controllerFail. Failed component may cause degraded-operation, loss-of-stability or loss-of-vehicle. Degraded-operation/ loss-of- stability: component continues to operate with increased failure rate (by 2 and 4 orders of magnitude respectively). Model of an ABS component w/ coincident failures SPN Models Representing Severity and Coincident Failures (3)
Each failure transition has a variable rate determined by a corresponding function. Failure of component B affects failure rate of component A by including the condition: if failedB then failureA = failureA * order where order is 100 in case of degraded operation and 10000 in case of loss of stability. double controllerRate() { double controller_rate = 0.0000006; if (mark("controllerLOS") > 0) return controller_rate * 10000; if ((mark("controllerDegraded") > 0) || mark("tubingDegraded") > 0)) return controller_rate * 100; return controller_rate; } Variable Rate to Model Coincident Failures SPN Models Representing Severity and Coincident Failures (4)
Model of an ABS component w/ usage-profiles SPN Models Representing Usage-Profiles (1- Same as SPNs, 2) • When a component fails, check if it was in “active” use or not. • The parameter 1/mu indicates the mean duration of active use while the parameter 1/alpha indicates the mean duration of passive use. • Failure of component in “active” mode only affects reliability.
Three individual SAN sub-models: Central_1, Central_2 and Wheel (replicated four times). The division into three sub-categories done to facilitate representation of coincident failures. Avoid replication of sub-nets where unnecessary. The Composed SAN Model for ABS SAN Models Representing Severity and Coincident Failures (2)
All subnets share common places: degraded, LOS, LOV and halted. Presence of tokens in degraded, LOS, and LOV places indicates degraded operation, loss of stability and loss of vehicle resp. Output cases of an activity have different probabilities to model conflict between the outcome of failure. Central_2 subnet with the Controller component highlighted SAN Models Representing Severity and Coincident Failures (3)
SAN Halting Condition Depicted SAN Halting Condition • Input condition on each activity states that it is enabled only if there is no token in halted place (common to all subnets). • Presence of token in halted place indicates an absorbing state.
Comparing SPN & SAN Results (1) • Because it is beyond the scope of this research to validate the results from the analytic experiments against real data, . . . • we compare the results from SPN & SAN analyses. • The difference in the range of actual reliability values between the SPN and SAN models may be attributed to the different ways in which the reliability reward is defined. • See the plots where both curves are in the same graph • Severity and Coincident Failures • SPNs - The curves for the two cases completely overlapped. • SANs - The curves diverge after 1K hours of operation.
Comparison of SPN and SAN Reliability Results for Models Representing Severity and Coincident Failures
Comparison of SPN and SAN Reliability Results for Models Representing Usage-Profiles (with failure severity and coincident failures)
Comparing SPN & SAN Results (2) • Usage Profiles • SPNs – Reliability for high usage decreases alarmingly within first 1K hrs, for low usage only after 2.5K hrs. • SANs - Reliability for high usage decreases alarmingly after 100 hrs, for low usage only perceptibly after 100 hours. • Results from both models agree on the fact that failure severity, coincident failures and usage-profiles contribute significantly to predicting system reliability. • Which of these results is more realistic? • Comparing cannot replace validation against real data.
Comparing SPN & SAN Results (3) Return to SEDS Related Publications