Download
1 / 2
20 likes | 224 Vues
Economic Highlights Five year average real GDP growth of 3.7%, higher than the world average of 3.3% but lower than the Africa average of 5.0%. The Rand (R) depreciated on average by 25% against the US$ between 2005 and 2009.

E N D
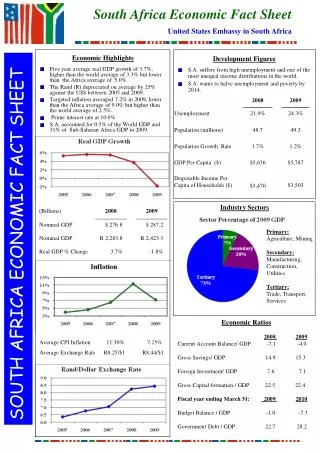
Economic Highlights Five year average real GDP growth of 3.7%, higher than the world average of 3.3% but lower than the Africa average of 5.0%. The Rand (R) depreciated on average by 25% against the US$ between 2005 and 2009. Targeted inflation averaged 7.2% in 2009, lower than the Africa average of 9.0% but higher than the world average of 2.5%. Prime interest rate at 10.0% S.A. accounted for 0.5% of the World GDP and 31% of Sub-Saharan Africa GDP in 2009. South Africa Economic Fact Sheet United States Embassy in South Africa SOUTH AFRICA ECONOMIC FACT SHEET • Development Figures • S.A. suffers from high unemployment and one of the most unequal income distributions in the world. • S.A. wants to halve unemployment and poverty by 2014. Industry Sectors Primary: Agriculture, Mining Secondary: Manufacturing, Construction, Utilities Tertiary: Trade, Transport, Services Economic Ratios 2008 2009 Current Account Balance/ GDP -7.1 -4.0 Gross Savings/ GDP 14.9 15.3 Foreign Investment/ GDP 7.6 7.1 Gross Capital formation / GDP 22.5 22.4 Fiscal year ending March 31: 2009 2010 Budget Balance / GDP -1.0 -7.3 Government Debt / GDP 22.7 28.2 Average CPI Inflation 11.30% 7.15% Average Exchange Rate R8.25/$1 R8.44/$1
United States Embassy in South Africa Updated on 31 March 2010Fact Sheets are released by the Public Affairs Office of the United States Embassy in South Africa For further information contact the Public Affairs Officer, United States Embassy, PO Box 9536, Pretoria 0001 Tel: (+27 12) 431 4386; Fax: (+27 12) 342 2090; Website: http://southafrica.usembassy.gov • U.S. Investment in South Africa • U.S. is the largest portfolio investor and second largest source of foreign direct investment in S.A. after the UK. • Total U.S. Portfolio investment = $41.0 billion • Total U.S. FDI = $5.7 billion (Dec. 31, 2008) • U.S.-South African Trade • U.S. is the third largest trading partner for S.A. after China and Germany (2009). • In 2009, S.A. exports to the U.S. decreased by 41%, while S.A. imports from the U.S. decreased by 32%. • S.A. AGOA exports to the U.S. were $2.4 billion in 2009. Note: Rand amounts converted to dollars using annual average rate