Download
1 / 27
290 likes | 466 Vues
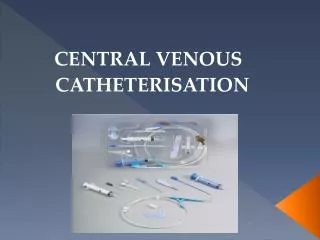
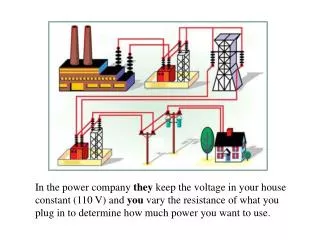
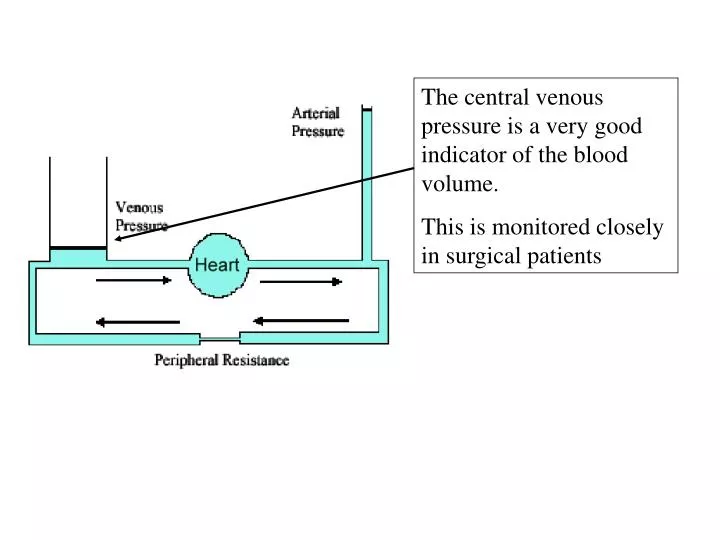
The central venous pressure is a very good indicator of the blood volume. This is monitored closely in surgical patients. In this diagram the heart is represented as the right heart , the lungs and the left heart all together.

E N D
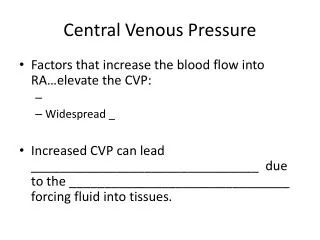
The central venous pressure is a very good indicator of the blood volume. This is monitored closely in surgical patients
In this diagram the heart is represented as the right heart , the lungs and the left heart all together.
The left and right hearts are synchronized because each ventricle pumps blood into the atrium of the the other ventricle. If output from one side falls then the ventricle behind it will force blood into its atrium until its output matches the other ventricle
Heart failure is where of myocardial contractility is reduced to the point that the heart can no longer meet the needs of the body
The chronically low blood pressure causes the kidney to retain fluid in an attempt to restore it.
Unfortunately no amount of fluid retention can restore the cardiac output because contractility is too low. Venous pressure gets so high (venous congestion) that edema forms at the capillaries and complications from the fluid retention becomes the major problem.
Signs and Symptoms • 1.Fatigue • 2.Low exercise tolerance • 3.Venous congestion and edema • 4.Dyspnea • 5.low ejection fraction - High mortality
Failure is often on only one side of the heart. Thus the healthy chamber can greatly raise the venous pressure of the affected chamber even without fluid retention. Often seen in acute infarction of the left ventricle where pulmonary edema mayoccur soon after occlusion.
If the heart tries to compensate for an abnormal work load by hypertrophy it will end in failure. It is literally replacing good muscle with inferior muscle.
Pressure overload causes concentric hypertrophy where the ventricle remodels inwardly to a low lumen volume and a thick wall. Caused by hypertension or outflow track obstruction.
Caused byregurgitant aortic valve or AV fistulas. Volume overload leads to eccentric hypertrophy. The heart remodels outwardly to give a large lumen volume and a thin wall
Post-infarction remodeling of the heart Myocardial infarction causes the surviving myocardium to hypertrophy as it takes over the work load.
Hypertrophy is an inappropriate way for the heart to compensate for an increased workload. Generally hypertrophy will progress to failure and therefore hypertrophy should be prevented
Trophic factors that contribute to hypertrophic remodeling. • Catecholamines • Angiotensin • Aldosterone • IGF-II • TGF-Beta
Idiopathic Myopathies Dilated Cardiomyopathy
Treatment of failure 1. Inotropic drugs seem obvious. They reduce symptoms in the short term but they actually shorten life. Such drugs include digitalis and phosphodiesterase inhibitors that preserve cAMP. 2. Beta blockers reduce the futile sympathetic drive to the heart that causes it to adversely remodel itself. These extend life. 3. ACE and Aldosterone inhibitors also prevent detrimental remodeling. These extend life. 4. Limit fluid accumulation with diuretics and low-salt diet. These extend life.
The Fick Principle Measurement of Cardiac output clinically is done by indicator dilution methods.
How many beakers pass under the spigot every minute? Each beaker represents 100 cc blood.
ΔX = [X]t QA Δt X = [X]t QA Δt X = QA [X]t dt QA = ∞ 0 X [X]t dt A more modern technique is the dye dilution method.
The original indicator was cardio green dye. It absorbed strongly at blood’s isosbestic point. That is the wavelength where oxygenated and deoxygenated blood absorb the same amount. Thus photometric detection of the dye is unaffected by the oxygen content of the blood. The problem is that repeated measurements cause build up of the dye.
The modern alternative is to use thermal dilution. Ice-cold saline is used as the indicator and a thermistor is used as a detector.
Cardiac Index = Cardiac Output / Body Surface Area • Clinical significance • The normal range of cardiac index is 2.6 - 4.2 L/min per square meter.