Download
1 / 1
10 likes | 117 Vues
Explore the enhanced capabilities of modern ionosondes in processing NeXtYZ results to determine parameters of traveling ionospheric disturbances (TID) and gravity waves (GW). Learn about PFISR's measurements of gravity waves and neutral winds as a prototype. Gain insights into the theoretical framework and practical implementation of GW dissipative theory for calculating neutral winds in the thermosphere. Discover how NeXtYZ inversion algorithm aids in profiling thermospheric neutral winds using cutting-edge ionosonde technology.

E N D
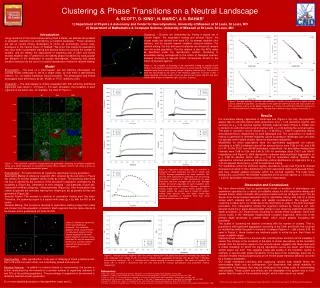
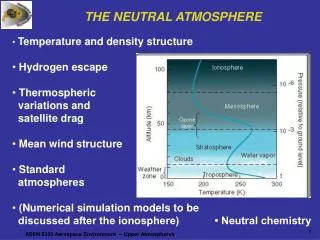
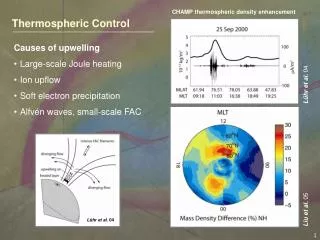
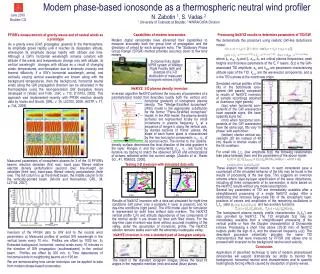
Z n → fp i+1 h i +1 fp i h i fp i -1 h i -1 fp i -2 h i -2 June 2010 Boulder CO Capabilities of modern ionosondes Processing NeXtYZ results to determine parameters of TID/GW • PFISR’s measurements of gravity waves and of neutral winds as a prototype • As a gravity wave (GW) propagates upwards in the thermosphere, its amplitude grows rapidly until it reaches its dissipation altitude, whereupon its amplitude decays rapidly with altitude and time. Although a GW’s horizontal wavelength remains constant with altitude if the winds and temperatures change only with altitude, its vertical wavelength changes with altitude as a result of changing winds, temperatures, and dissipation due to kinematic viscosity and thermal diffusivity. If a GW’s horizontal wavelength, period, and vertically varying vertical wavelengths are known along with the background temperatures, then the background, horizontal neutral winds along the GW propagation direction can be calculated in the thermosphere using the next-generation GW dissipative theory developed in [Vadas and Fritts, JGR, v. 110, D15103, 2005]. This approach was implemented recently with PFISR electron density data by Vadas and Nicolls, [GRL, v. 35, L02105, 2008; JASTP, v. 71, p. 744, 2009]. We demonstrate this procedure using realistic GW-like disturbance model: , , where fE, zmE, hEand fF, zmF, hFare critical plasma frequencies, peak heights and thickness parameters of the E, F layers, δ(z) is the GW-associated TID amplitude, zmand hGWare parameters characterizing altitude span of the TID, kx,y,zare the wavevector components, and φis the TID’s phase at the coordinate origin. Modern digital ionosondes have advanced their capabilities to measure accurately both the group time of propagation and the directions of arrival for each ionogram echo. The ‘Stationary Phase Group Range’ (SPGR) method provides accuracy down to few tens meters. 8-channel fully digital VIPIR system at Wallops Flight Facility (left) and example of a 3-D distribution of measured ionogram echoes (right). Simulated vertical profiles of the tilts in the bottomside iono-sphere (left panels) compared to results of NeXtYZ inversion of sample recordings obtained at Jicamarca (right panels): (top) when horizontal com-ponentsof the GW wavevector have opposite signs, tilts have opposite signs too; (mid) when horizontal com-ponentsof the GW wavevector have the same sign, tilts vary “in phase” with each other; (bottom) shorter vertical wa-velength(20 km instead of 40 km) results in shorter scales of the tilt variations. Modern phase-based ionosonde as a thermospheric neutral wind profiler NeXtYZ: 3-D plasma density inversion Inversion algorithm NeXtYZ performs the recovery of parameters of a parameterized model that describes locally both the vertical and horizontal gradients of ionospheric plasma density. The "Wedge-Stratified Ionosphere" (WSI) model is the appropriate substitution for the former "Plane-Stratified Ionosphere" model. In the WSI model, the plasma density surfaces are represented locally for small increments in plasma frequency fp at a sequence of ranges hi along the vertical axis, by slanted sections of “frame” planes; the slope of each frame plane is characterized by the two horizontal components nxi, nyi of its normal vector. The normal to the plasma density surface determines the local direction of the total gradient in the layer. Ranges hi and the components nxi, nyi are found by iterative ray tracing to match the observed SPGR and echolocations of echoes reflected within the current wedge. [Zabotin et al., Radio Sci., 41, RS6S32, 2006]. For small tilts tx,ty, (low amplitude δ(z)) the following relationships take place between them and the parameters of the above model: These explain the simulation results. In each considered case a counterpart of the simulated behavior of the tilts may be found in the results of processing of the real data. This suggests an inversion scheme where layer-by-layer specification of the wave disturbance, including all three components of its wavevector, is done based on the NeXtYZ results without any model assumptions. Several key parameters of TID are immediately available after a straightforward processing of a single NeXtYZ output. After a detrending that removes large-scale tilts of the ionospheric layer, positions of zeroes and amplitudes of the remaining oscillations in tx,ty, yield and two auxiliary functions The background plasma density profile characteristics (f0,f0z′) are also provided by NeXtYZ. The TID amplitude δ(z)may be immediately available from a straightforward processing of the vertical profile or from the Doppler characteristics of Dynasonde echoes. Processing a short time series (20-30 min) of NeXtYZ outputs yields the sign of kzand the observed frequency ω(z). The described procedure essentially provides the same TID characteristics that were measured by PFISR and allows one to proceed with inversion to the background neutral wind velocity. Ionosphere Vertical N. Zabotin 1, S. Vadas 2 1 University of Colorado at Boulder, 2 NWRA/CoRA Division Magnetic Field Lines Measured parameters of ionospheric plasma for 3 of the 10 PFISR’s beams: electron densities (first row); band pass filtered relative electron density perturbations (second row); line-of-sight ion velocities (third row); band-pass filtered velocity perturbations (forth row). The left column is up the B-field beam, the middle column is for the vertically-pointed beam. [Nicolls and Heinselman, GRL, 34, L21104, 2007]. (θi,φi) Testing 3-D inversion with simulated data sets i+1 hi f3 i f2 f1 Dynasonde Results of NeXtYZ inversion with a data set simulated for night-time conditions (left panel; only a parabolic F layer is present), and for day-time conditions (right panel). The WSI model used for simulation is represented by solid lines without data markers. The NeXtYZ vertical profile fp(h) and altitude dependence of two components of the normal vector n are shown by lines with filled circles. For the day-time case inversion was done without accurate modeling of the valley, under the assumption of monotonic profile. The NeXtYZ solution remains stable even with the extremely inadequate valley. Inversion of the PFISR data to GW and to the neutral wind parameters: a) Measured profiles of vertical GW wavelength in the vertical beam every 10 min. Profiles are offset by 1000 km. b) Extracted background, horizontal, neutral winds every 10 minutes in the direction of GW propagation (southeastward) in the vertical beam. Profiles are offset by 300 m/s. c) Time dependence of horizontal winds in neighboring beams at z=190 km. We are demonstrating how similar technique can be applied to data from modern phase-based ionosondes. NeXtYZ inversion is now a standard part of ionogram analysis Conclusion Application of described technique to data of modern phase-based ionosondes will expand dramatically our ability to monitor the background, horizontal neutral wind characteristics and to quantify heating/body forcing effects caused by dissipation of gravity waves. The insert in the standard ionogram imagesshows the local tilt angles in the magnetic meridian (red) and zonal (blue) planes.