Download
1 / 68
680 likes | 814 Vues
Understanding California Home Sellers. January 30, 2014 Oscar Wei, Senior Research Analyst. Methodology. Telephone surveys conducted in August/September of 600 randomly selected home sellers who sold in the past 6 months.

E N D
Understanding California Home Sellers January 30, 2014 Oscar Wei, Senior Research Analyst
Methodology • Telephone surveys conducted in August/September of 600 randomly selected home sellers who sold in the past 6 months. • Maximum sampling error: ±4.0 percent at two standard deviations (a 95% confidence level). (Subsets of the total sample will have a higher sampling error.)
Sales of Existing Detached Homes • California, Dec. 2013 Sales: 361,890 Units, -5.9% YTD, -18.6% YTY SERIES: Sales of Existing Single Family Homes SOURCE: CALIFORNIA ASSOCIATION OF REALTORS® *Sales are seasonally adjusted and annualized
Median Price of Existing Detached Homes • California, December 2013: $438,040, Up 19.7% YTY SERIES: Median Price of Existing Single Family Homes SOURCE: CALIFORNIA ASSOCIATION OF REALTORS®
Share of Equity Sales Decreased for the First Time Since December 2012 SERIES: Distressed Sales SOURCE: CALIFORNIA ASSOCIATION OF REALTORS®
Unsold Inventory Index • California, December 2013: 3.0 Months Note: “Unsold Inventory Index” represents the number of months it would take to sell the remaining inventory for the month in question. The remaining inventory for the month is defined as the number of properties that were “Active”, “Pending”, and “Contingent” (when available) and divide the sum by the number of “Sold” properties for the month in question. SERIES: Unsold Inventory Index of Existing Single Family Homes SOURCE: CALIFORNIA ASSOCIATION OF REALTORS®
Short Sales Market Shrank as Home Prices Surged Q: Was the home sold as a short sale?
Mortgage Rates: Heading Higher as Economy Improves and Fed Tapers • January 2009 – December 2013 WEEKLY MONTHLY SERIES: 30Yr FRM, 1Yr ARM SOURCE: Federal Home Loan Mortgage Corporation
Sellers Received 5.9 Offers on Average Q: How many offers did you receive from buyers?
98% of Sellers Received Multiple Offers Q: How many offers did you receive from buyers?
Market Competition Leads to More Sales with Above Asking Price Long Run Average = 18%
Market Competition Leads to More Sales with Above Asking Price
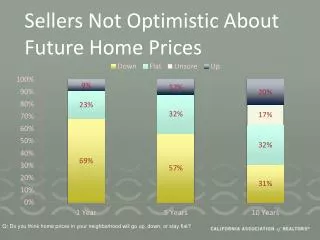
Sellers Are Optimistic About Future Home Prices Q: Do you think home prices in your neighborhood will go up, down, or stay flat?
Sellers More Optimistic About Future Home Prices Q: Do you think home prices in your neighborhood will go up?
“Financial Difficulties” was #1 Reason for Selling in 2012 *Financial difficulties include: couldn’t afford mortgage, moved to less expensive market, loss of household income, income not keeping up with expenses, monthly payment went up, new job paid less, needed to move to less expensive residence. Q: Why did you sell your home?
“Moving up” is #1 Reason for Selling in 2013 *Financial difficulties include: couldn’t afford mortgage, moved to less expensive market, loss of household income, income not keeping up with expenses, monthly payment went up, new job paid less, needed to move to less expensive residence. Q: Why did you sell your home?
Moving up is #1 Reason for Selling for Both First-Time Sellers and Repeat Sellers *Financial difficulties include: couldn’t afford mortgage, moved to less expensive market, loss of household income, income not keeping up with expenses, monthly payment went up, new job paid less, needed to move to less expensive residence. Q: Why did you sell your home?
Most Sellers Currently Own Q: Do you own or rent your current home?
Short Seller Are More Likely to Rent Q: Do you own or rent your current home?
Most Sellers Own Q: Do you own or rent your current home?
For Renters Who Do Not Plan to Repurchase, Here Are Their Reasons: SERIES: 2013 California Home Seller Survey SOURCE: CALIFORNIA ASSOCIATION OF REALTORS®
Median Age: 46 Q: What is your age?
Gen X and Y Dominate Seller Population Q: What is your age?
Half of All Sellers are Married Q:What was the marital status the head of your household at the time of the sale?
Minorities are the Majority Q: How would you describe your ethnic background?
Household Income Q: Which of the following categories best describes your total annual household income from all sources?
First-time Sellers Q: Was this your first experience in selling a house?
Length of Ownership Spiked Q: Length of time home was owned prior to sale.
Length of homeownership surgedImplication: Sellers who bought during the peak decided to sell as price increases minimized losses Q: Length of time home was owned prior to sale.
A Typical Home Owner Considered Selling for a Year Before Actually Doing So Q: How long did you consider selling before actually doing so?
The Time It Took to Consider Selling Has Been Consistent in the Last Few Years
Half of All Homes Were on the Market for 6 Weeks or Less Q: How many weeks was your home listed on the market prior to the opening of a successful escrow?
Decline in Average Weeks on Market Reflects Tight Inventory Q: How many weeks was your home listed on the market prior to the opening of a successful escrow?
¾ of Sellers Closed Escrow Within 60 Days Q: How long was your home in escrow?
Average Days in Escrow Q: How long was your home in escrow?
Most Sellers Used Social Media • Q: Did you use social media in the home selling process?
74% of All Sellers Used Social Media 83% 39% 52% 24% 19% • Q: Which social media websites did you use to learn more about and communicate with real estate agents and companies?
What Sellers Would Change About the Sale - 2012 Q: If there was one thing you could change about your recent home sale, what would it be?
What Sellers Would Change About the Sale - 2013 Q: If there was one thing you could change about your recent home sale, what would it be?
More than Half of Sellers Found Agent Online • Q. How did you find your real estate agent?
Over ¾ of Sellers Interviewed at Least 3 Agents Q: How many agents did you interview prior to selecting the agent you used in your recent home selling process?
Sellers Interviewed Fewer Agents Q: How many agents did you interview prior to selecting the agent you used in your recent home selling process?