Download

1 / 82
820 likes | 1k Vues
Proteomics Informatics Workshop Part I: Protein Identification David Fenyö February 4, 2011. Introduction to proteomics Introduction to mass spectrometry Analysis of mass spectra Database searching Spectrum library searching de novo sequencing Significance testing .

E N D
Proteomics Informatics Workshop Part I: Protein Identification David Fenyö February 4, 2011 • Introduction to proteomics • Introduction to mass spectrometry • Analysis of mass spectra • Database searching • Spectrum library searching • de novo sequencing • Significance testing
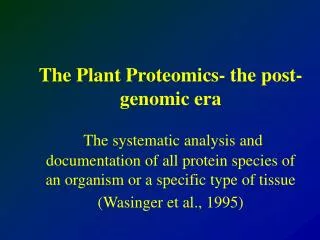
Why Proteomics? Geiger et al., “Proteomic changes resulting from gene copy number variations in cancer cells”, PLoS Genet. 2010 Sep 2;6(9). pii: e1001090.
Proteomics Informatics MS/MS Biological System Experimental Design Samples Sample Preparation MS Measurements Data Analysis Data Analysis What does the sample contain? How much? What does the sample contain? How much? Information about each sample Information Integration Information about the biological system
Sample Preparation MS/MS Biological System Experimental Design Enrichment Separation etc Samples Sample Preparation Digestion MS Measurements Top down Bottom up Data Analysis What does the sample contain? How much? What does the sample contain? How much? Information about each sample Information Integration Information about the biological system
Mass Spectrometry (MS) Ion Source Mass Analyzer Detector MALDI ESI Quadrupole Ion Trap (3D, linear) Time-of-Flight Orbitrap FTICR intensity mass/charge
Mass Spectrometry – MALDI-TOF Ion Source Mass Analyzer Detector Detector MALDI Time-of-Flight HV Ion mirror Laser Detector
Tandem Mass Spectrometry (MS/MS) Ion Source Detector CAD –Collision Activated Dissociation Mass Analyzer 1 Frag-mentation Mass Analyzer 2 Quadrupole Quadrupole Quadrupole NO m/z m/z m/z time time time intensity YES m/z m/z m/z mass/charge time time time YES m/z m/z m/z time time time Dm/z is constant
Dissociation Techniques CAD: Collision Activated Dissociation (b, y ions) increase of internal energy through collisions ETD: Electron Transfer Dissociation (c, z ions) radical driven fragmentation
Dissociation Techniques: CAD versus ETD CAD Low charge Short peptides Weakest bonds break first Preferred cleavage N-terminal to proline ETD High charge Up to intact proteins More uniform fragmentation No cleavage N-terminal to proline
Liquid Chromatography (LC)-MS/MS LC Ion Source Mass Analyzer 1 Frag-mentation Mass Analyzer 2 Detector intensity intensity intensity intensity intensity intensity intensity intensity intensity intensity intensity intensity intensity intensity intensity Time mass/charge mass/charge mass/charge mass/charge mass/charge mass/charge mass/charge mass/charge mass/charge mass/charge mass/charge mass/charge mass/charge mass/charge mass/charge
Data Independent Acquisistion • MS • MS/MS 1 • MS/MS 2 • MS/MS 3 • MS • MS/MS 1 • MS/MS 2 • MS/MS 3 • MS • MS/MS 1 • MS/MS 2 • MS/MS 3 • MS • MS/MS 1 • MS/MS 2 • MS/MS 3 • MS • MS/MS 1 • MS/MS 2 • MS/MS 3 • MS • MS/MS 1 • MS/MS 2 • MS/MS 3 • … intensity mass/charge intensity mass/charge intensity mass/charge intensity mass/charge intensity mass/charge intensity mass/charge
Data Dependent Acquisistion • MS • MS/MS 1 • MS/MS 2 • MS/MS 3 • MS/MS 4 • MS/MS 5 • MS/MS 6 • MS/MS 7 • MS/MS 8 • MS/MS 9 • MS/MS 10 • MS • MS/MS 1 • MS/MS 2 • MS/MS 3 • MS/MS 4 • MS/MS 5 • MS/MS 6 • MS/MS 7 • MS/MS 8 • MS/MS 9 • MS/MS 10 • … intensity mass/charge intensity mass/charge
Mass Spectrometry – ESI-LC-MS/MS ESI Linear Ion Trap HCD Ion Source Mass Analyzer 1 Frag-mentation CAD ETD Frag-mentation Detector Mass Analyzer 2 Detector Orbitrap Olsen J V et al. Mol Cell Proteomics 2009;8:2759-2769
Charge-State Distributions MALDI ESI 1+ 2+ 3+ intensity intensity Peptide 4+ 1+ 2+ mass/charge mass/charge M - molecular mass n - number of charges H – mass of a proton MALDI ESI 2+ 27+ 1+ 3+ 31+ Protein intensity intensity 4+ 5+ mass/charge mass/charge
Isotope Distributions 12C 14N 16O 1H 32S +1Da Intensity +2Da +3Da m/z m/z m/z 0.015% 2H 1.11% 13C 0.366% 15N 0.038% 17O, 0.200% 18O, 0.75% 33S, 4.21% 34S, 0.02% 36S Only 12C and 13C: p=0.0111 n is the number of C in the peptide m is the number of 13C in the peptide Tm is the relative intensity of the peptide m 13C
Isotope distributions Intensity ratio Intensity ratio Peptide mass Peptide mass GFP 29kDa monoisotopic mass m/z
Noise Intensity m/z
Peak Finding Find maxima of Intensity The signal in a peak can be estimated with the RMSD m/z and the signal-to-noise ratio of a peak can be estimated by dividing the signal with the RMSD of the background The centroid m/z of a peak
Isotope Clusters and Charge State 0.33 0.5 1 1+ 2+ 3+ Possible to Determine Charge? Yes Yes Maybe No 0.33 0.5 1 Intensity 0.33 0.5 1 m/z
Identification – Peptide Mass Fingerprinting Lysis Fractionation Digestion Mass spectrometry MS Identified Proteins
Information Content in a Single Mass Measurement Human 10 8 6 Avg. #of matching peptides 4 3 2 1 1 2 3 4 6 8 10 #of matching peptides 1000 2000 3000 Tryptic peptide mass [Da] S. cerevisiae 10 8 6 Avg. #of matching peptides 4 3 2 1 1 2 3 4 6 8 10 #of matching peptides 1000 2000 3000 Tryptic peptide mass [Da]
Identification – Peptide Mass Fingerprinting Lysis Fractionation Digestion Mass spectrometry Peak Finding Charge determination De-isotoping Searching MS Identified Proteins
Identification – Peptide Mass Fingerprinting Sequence DB Pick Protein Digestion MS All Peptide Masses Repeat for each protein MS Compare, Score, Test Significance Identified Proteins
ProFound – Search Parameters http://prowl.rockefeller.edu/
Example data – ESI-LC-MS/MS 762 100 875 [M+2H]2+ % Relative Abundance 633 292 405 534 1022 260 389 504 907 1020 663 778 1080 0 250 500 750 1000 m/z m/z MS/MS Time
Peptide Fragmentation b Ion Source Mass Analyzer 1 Frag-mentation Mass Analyzer 2 Detector y
Tandem MS – Sequence Confirmation S G F L E E D E L K 100 % Relative Abundance 0 250 500 750 1000 m/z
Tandem MS – Sequence Confirmation 88 145 292 405 534 663 778 907 1020 1166 b ions S S G G F F L L E E E E D D E E L L K K 100 % Relative Abundance 0 250 500 750 1000 m/z
Tandem MS – Sequence Confirmation 88 145 292 405 534 663 778 907 1020 1166 b ions S S G G F F L L E E E E D D E E L L K K 1166 1080 1022 875 762 633 504 389 260 147 y ions 100 % Relative Abundance 0 250 500 750 1000 m/z
Tandem MS – Sequence Confirmation 88 145 292 405 534 663 778 907 1020 1166 b ions S S G G F F L L E E E E D D E E L L K K 1166 1080 1022 875 762 633 504 389 260 147 y ions 762 100 875 [M+2H]2+ % Relative Abundance 633 292 405 534 1022 260 389 504 907 1020 663 778 1080 0 250 500 750 1000 m/z
Tandem MS – Sequence Confirmation 88 145 292 405 534 663 778 907 1020 1166 b ions S S G G F F L L E E E E D D E E L L K K 1166 1080 1022 875 762 633 504 389 260 147 y ions 762 100 875 [M+2H]2+ % Relative Abundance 633 292 405 534 1022 260 389 504 907 1020 663 778 1080 0 250 500 750 1000 m/z
Tandem MS – Sequence Confirmation 88 145 292 405 534 663 778 907 1020 1166 b ions S S G G F F L L E E E E D D E E L L K K 1166 1080 1022 875 762 633 504 389 260 147 y ions 762 100 875 113 [M+2H]2+ 113 % Relative Abundance 633 292 405 534 1022 260 389 504 907 1020 663 778 1080 0 250 500 750 1000 m/z
Tandem MS – Sequence Confirmation 88 145 292 405 534 663 778 907 1020 1166 b ions S S G G F F L L E E E E D D E E L L K K 1166 1080 1022 875 762 633 504 389 260 147 y ions 762 100 129 875 [M+2H]2+ % Relative Abundance 129 633 292 405 534 1022 260 389 504 907 1020 663 778 1080 0 250 500 750 1000 m/z
Tandem MS – Sequence Confirmation 88 145 292 405 534 663 778 907 1020 1166 b ions S S G G F F L L E E E E D D E E L L K K 1166 1080 1022 875 762 633 504 389 260 147 y ions 762 100 875 [M+2H]2+ % Relative Abundance 633 292 405 534 1022 260 389 504 907 1020 663 778 1080 0 250 500 750 1000 m/z
Tandem MS – Sequence Confirmation 88 145 292 405 534 663 778 907 1020 1166 b ions S S G G F F L L E E E E D D E E L L K K 1166 1080 1022 875 762 633 504 389 260 147 y ions 762 100 875 [M+2H]2+ % Relative Abundance 633 292 405 534 1022 260 389 504 907 1020 663 778 1080 0 250 500 750 1000 m/z
Tandem MS – Sequence Confirmation 88 145 292 405 534 663 778 907 1020 1166 b ions S S G G F F L L E E E E D D E E L L K K 1166 1080 1022 875 762 633 504 389 260 147 y ions 762 100 875 [M+2H]2+ % Relative Abundance 633 292 405 534 1022 260 389 504 907 1020 663 778 1080 0 250 500 750 1000 m/z
Tandem MS – de novo Sequencing 762 100 Amino acid masses 875 [M+2H]2+ % Relative Abundance 633 292 405 534 1022 260 389 504 907 1020 663 778 1080 0 250 500 750 1000 m/z Mass Differences Sequences consistent with spectrum
Tandem MS – de novo Sequencing X X X • SGF(I/L)EEDE(I/L)… • 1166 – 1020 – 18 = 128 • K or Q • SGF(I/L)EEDE(I/L)(K/Q) …GF(I/L)EEDE(I/L)… …(I/L)EDEE(I/L)FG… …GF(I/L)EEDE(I/L)… …(I/L)EDEE(I/L)FG… Peptide M+H = 1166 1166 -1079 = 87 => S SGF(I/L)EEDE(I/L)… X X X
Tandem MS – de novo Sequencing Challenges in de novo sequencing Neutral loss (-H2O, -NH3) Modifications Background peaks Incomplete information Challenges in de novo sequencing Neutral loss (-H2O, -NH3) Modifications Background peaks Incomplete information
Tandem MS – Database Search Sequence DB Lysis Fractionation Pick Protein Digestion LC-MS Pick Peptide Repeat for all proteins MS/MS All Fragment Masses Repeat for all peptides MS/MS Compare, Score, Test Significance
X! Tandem - Search Parameters http://www.thegpm.org/
Multi-stage searching spectra Tryptic cleavage Modifications #1 sequences Modifications #2 sequences Point mutation X! Tandem