Download
1 / 18
180 likes | 352 Vues
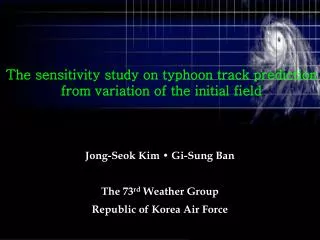
The sensitivity study on typhoon track prediction from variation of the initial field. Jong-Seok Kim • Gi-Sung Ban The 73 rd Weather Group Republic of Korea Air Force. Introduction. Background There are two principal Factors affecting typhoon track

E N D
The sensitivity study on typhoon track prediction from variation of the initial field Jong-Seok Kim • Gi-Sung Ban The 73rd Weather Group Republic of Korea Air Force
Introduction • Background • There are two principal Factors affecting typhoon track • : One is Variation of synoptic field around a typhoon • and the other is transformation of typhoon structure • Field error of typhoon environmental area result in • track forecast error increase as forecast time is extended • - these factor is not a accurate, resulting these generate • errors in typhoon track forecast. • Object • try to improve Korea Air Force typhoon track forecast • Improved model initial field • is composed of typhoon area applying FDDA • and typhoon environmental area using analysis field at initial time
Configuration of KAF-TYP Model Version MM5 Version 3.5 Horizontal Dimension(Resolution) 121 X 141 (36km) Time Integration 90 sec Vertical layer 23 Sigma Layer Forecast time 84hr Implicit Physics Scheme Reisner II Cumulus Parameterization Kain-Fritsch Planetary Boundary Layer MRF Radiation Parameterization RRTM Initial Data GDAPS 1.875 ˚(-12hr, -6hr, 00hr) NOAA Weekly Mean SST Typhoon Data (-12hr, -6hr, 00hr)
Analysis Field(-12hr) Bogussing Field(-12hr) Bogussing FDDA FDDA FDDA FDDA Field(-12hr) FDDA Field(-6hr) FDDA Field(00hr) Analysis Field(00hr) Bogussing Field(00hr) Analysis Field(-6hr) Bogussing Field(-6hr) Bogussing Bogussing Configuration of KAF-TYP(Continued) Typhoon Bogussing JMA typhoon bogussing method to insert artificial typhoon in the initial field for every 6hr in 12hr FDDA initialfield applied FDDA about wind field every 6hr in 12hr.
FDDA Field for 12hr(00hr) Analysis Field(00hr) An issue of KAF-TYP • compared the model initial field(FDDA)with analysis field at same time • A clear Difference on typhoon environmental area • At the initial field applying FDDA on whole domain • Reinforce of the inner typhoon structure is prominent • As forecast time is extended, • Analysis error generated in initial time increase, • 48hr typhoon track forecast error is amplified
Typhoon area is replaced of an artificial typhoon (every 6hr in 12hr) Environmental area : Analysis Field of initial time (00hr) An artificial typhoon is combined with the revised environmental area : Improved initial Field Improvement of KAF-TYP • To improve initial Field of KAF-TYP to reduce analysis field • Reinforce typhoon structure • (by using the typhoon bogussing and FDDA) • Reduce analysis field error to typhoon environmental area
Method of Bogussing FDDA Time CTRL 12hr 12hr EXP1 NO (analysis field) NO NEW Typhoon area : 12hr FDDA + 12hr Bogussing Environmental area : (No FDDA) analysis Field Methodology • Experimental Design CTRL means applied whole model domain by FDDA. NEW means using improved initial field was divided inner and outer typhoon area. • Typhoon data explanation • Typhoon developed on Northwest Pacific on May-October 2004 • There are 20 typhoons in this period and we operated model by 159 times
Case Study 1 Track Forecast Track Forecast Error 1200/16/08/2004 CTRL(km) NEW(km) 12hr 174.2 105.6 24hr 279.7 104.8 36hr 366.1 214.0 48hr 356.2 283.8 60hr 386.6 332.3 72hr 489.4 256.9 Surface Chart 2004-081612
5880 5880 Case Study 1 (Continued) • Initial Field of 00hr : 500hPa Geopotential Height 1200/16/08/2004 CTRL NEW
1008 1008 Case Study 1 (Continued) • Field of 48hr Forecast : Sea Level Pressure 1200/18/08/2004 CTRL NEW
5880 5880 Case Study 1 (Continued) • Field of 48hr Forecast:500hPa Geopotential Height 1200/18/08/2004 CTRL NEW
1200/02/09/2004 CTRL(km) NEW(km) 1200/04/09/2004 0000/03/09/2004 0000/05/09/2004 1200/03/09/2004 0000/04/09/2004 CTRL(km) CTRL(km) CTRL(km) CTRL(km) CTRL(km) NEW(km) NEW(km) NEW(km) NEW(km) NEW(km) 12hr 50.0 50.0 12hr 12hr 12hr 12hr 12hr 27.5 14.2 12.0 60.9 44.0 27.5 33.0 40.1 60.9 23.0 24hr 33.0 33.0 24hr 24hr 24hr 24hr 24hr 39.9 88.9 29.0 72.5 85.9 39.9 88.9 85.9 89.9 62.1 36hr 91.1 22.1 36hr 36hr 36hr 36hr 36hr 142.6 179.3 174.8 155.6 83.7 97.8 104.3 147.3 103.8 122.3 48hr 138.9 155.0 83.3 48hr 48hr 48hr 48hr 48hr 254.6 239.5 216.8 174.8 312.4 207.1 147.3 236.3 148.6 60hr 191.5 118.3 60hr 60hr 60hr 60hr 60hr 546.3 291.7 533.2 312.4 403.8 374.9 211.1 383.9 220.0 234.5 72hr 197.5 114.6 72hr 72hr 72hr 72hr 72hr 1279.2 388.3 368.4 472.2 694.5 971.6 299.0 298.5 470.3 437.1 Surface Chart Case Study 2 Track Forecast Track Forecast Error 2004-090500
5880 5880 Case Study 2 (Continued) • Initial Field of 00hr : 500hPa Geopotential Height 1200/02/09/2004 CTRL NEW
5880 5880 Case Study 2 (Continued) • Field of 72hr Forecast:500hPa Geopotential Height 1200/05/09/2004 CTRL NEW
46.4 50.2 35.6 12.3 Result • Mean Track Forecast Error • Typhoon developed on May-October 2004 428.6 New case shows more advenced result than CTRL as time going up (specially after 36 hr) New case will offer better forecast result 326.8 246.4 188.7 141.4 84.4 suppose NEW case will offer better forecast data to forecasters
Analysis error of environmental area is more reduced Simulation of typhoon environmental field is improved Conclusion Case using initial field applying FDDA only on typhoon area(NEW) than whole domain(CTRL) Advancement of 48hr typhoon track forecast Improvement of track forecast for pre-grade cyclone
Furthermore, with advancement of bogussing method will study of reducement typhoon track forecast error by varying intensity Will try to improve typhoon track forecast Future Work Using high resolution data(AVN 1˚X1˚, GDAPS 0.56˚X0.56 ˚) Analyze typhoon track forecast depend on initial field resolution