Download
1 / 13
130 likes | 231 Vues
Promoting road safety by educating drivers that cyclists are also road users. Program targets drivers aged 16-65 in Onondaga County to reduce bicycle fatalities. References to distracted driving studies highlight the importance of awareness and attentiveness on the road.

E N D
Cyclists Are Drivers TOO Hannah Miles April 24, 2014
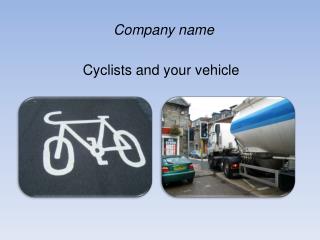
Cyclists Are Drivers TOO • Bicycle fatalities are prominent in Onondaga County with a rate of .2 of every 100,000 people per year. • This program is designed to inform drivers between the ages of 16 and 65 that especially in the warmer weather, there are many people riding bicycles in the road. People who are behind the wheel of a car need to be more aware of everyone that is on the road and understand that bicyclists are drivers too.
Community Need Chart Source: http://cnyvitals.org/onondaga/technology/bicycle-fatalities.pdf
Logical Approach Literature Review • Hickson’s article discusses how elderly people are distracted drivers in the sense that when they are hearing impaired they are distracted by the lack of auditory use. “Attending to auditory information has been shown to impair performance on concurrent cognitive motor tasks.” – learning that using any extra auditory devices impair driving and makes people less aware of their surroundings on the road • Wilson’s article discusses distracted driving saying that “studies using a naturalistic methodology suggested that relative to nondistracted drivers, those drivers who text are 23 times as likely to crash.” – another distraction that keeps the eyes off the road and unaware of other “vehicles” around them
Logical Approach Literature Review • Ferdinand’s article is about a study that was done to find if the use of mobile devices while driving had an impact on the driving. They looked at various secondary tasks and found that the studies that examined mobile phone while driving were 16% more likely to find a relationship between mobile phone use and accidents. – once again this distractor impairs the adequacy of driving and staying in the lane
Logical Approach Works Cited • Ferdinand, Alva O . 2014 "Associations Between Driving Performance and Engaging in Secondary Tasks: A Systematic Review." American Journal of Public Health 104(3):39- 48. • Hickson, Louise . 2010 "Hearing Impairment Affects Older People’s Ability to Drive in the Presence of Distracters." Journal of the American Geriatrics Society 58(6):1097-1103. • Wilson, Fernando . 2010 "Trends in Fatalities from Distracted Driving in the United States, 1999 to 2008." American Journal of Public Health 100(11):2213-2219.
Data Analysis • My program did not work because according to my crosstabs, those that were in the program increased from 46% to 53% after being in the program meaning that the relationship between taking the program and not getting into an accident is not statistically significant. However, according to my logistic regression my program did work because it was statistically significant at the .05 level.