Download

1 / 19
190 likes | 405 Vues
2. Research Goals. Every development project has economic and environmental impactsInformed decision making requires the community and planners to consider and evaluate both impactsThe goal is to develop a watershed information tool (WIT) to help estimate these impacts. 3. Research Components. Ec

E N D
1. 1 Analyzing Life-cycle Environmental Impacts of Local development Initiatives Using Regional Economic and Environmental Input-Output models
Dr. Satish Joshi
Department of Agricultural Economics
Michigan State University
2. 2 Research Goals Every development project has economic and environmental impacts
Informed decision making requires the community and planners to consider and evaluate both impacts
The goal is to develop a watershed information tool (WIT) to help estimate these impacts
3. 3 Research Components Economic impact analysis module (Conventional Regional IO model)
Environmental database
User friendly software development
Case studies illustrating the use of the tool
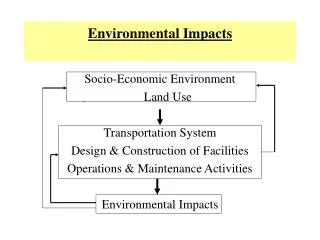
4. 4 Project Effects Direct effects
Directly due to project activities
Indirect effects
Due to increases in the outputs of industries supplying inputs to the project activities
Induced effects
Additional household income will lead to increased consumption expenditures and increased output of food, clothing etc.
Local effects v/s Total effects
One time activities v/s continuing activities
5. 5 Economic Impact Module Regional input-output model for the Muskegon River Watershed
Special watershed level dataset
78 zip code areas over 13 counties
528 sector detail
Based on national technical coefficients, adjusted with a regional purchase coefficient vector.
6. 6 Economic Impact Module Input
Project cost components [Labor, different materials, services]
Output : Direct, Indirect and Induced effects on
Local employment
Output of various sectors
Local wage income, other income
Business Tax revenues
7. 7 Environmental Impact Module Increased production and consumption imply increased pollutant emissions and resource use
Estimate emission factors and resource use intensities for different sectors and households
Link with economic module to estimate total changes in emissions and resource use
8. 8 Environmental Impact Module Air, water, land emissions
Energy, minerals, water consumption
Summary indices
Global warming potential, Acidification potential, eutrophication, toxicity weighting, total energy
Monetary valuation
Carnegie Mellon University�s EIO-LCA+
9. 9 Software Input [Project cost estimates]
Identifying appropriate industry sectors
Economic impact analysis (RIO model)
Environmental impact analysis
Output Reports generation
10. 10 Case Study: Middle branch River Restoration Tributary of Muskegon River
33 Miles long, Osceola County
Old dam in Marion Village
Mill Pond 26 acres
Dam is unused, safety hazard, thermal pollution (6-9 degrees higher), No cold water fish down stream
Mill pond is sediment filled, shallow, doesn�t support fish or recreation
11. 11 Project Components Dam Removal and River restoration
Mill pond retaining berm construction
Mill pond dredging and restoration
Recreation facilities [Walkway, bridge, fishing platforms, boat launch area]
12. 12
13. 13 Project Cost Feasibility study by Progressive AE, Grand Rapids
Estimated cost $4.28 million
Estimated direct labor costs $2.02 million
River restoration +berm =$1.988 million
Pond Restoration = $2.043 million
Recreation Elements=$0.487 Million
14. 14 Project cost components
15. 15 Economic Impacts Local Employment Generation (annual FTE)
Direct = 47.8
Indirect = 24.2
Induced = 5.6
Total = 77.6
Local Economic Output $1.98 Million
Local Personal Income $0.089 Million
Indirect Business Taxes $0.073 Million
16. 16 Environmental Emissions (indirect + Induced) Energy use 4.04 TJ
Conv. Pollutants 4.86 MT
GHG emissions 305.35 MT CO2eq
Fuels 3.77 TJ
RCRA Wastes 0.41 MT
Toxic Releases 0.016 MT
Toxic Releases (wtd) 0.097 MT CMUET
17. 17 Direct Environmental Benefits Main direct ongoing benefit is restoration of 16 miles of cold water fishing stream
Other benefits are
Safety risk reduction, Habitat improvement for other species, Sediment, nutrient, water quality improvement, Aesthetics
Mostly estimated outside the WIT
18. 18 Michigan Angling Demand Model Estimates effect of water quality changes on fishing trips statewide by type and county
16 miles cold water fishing stream restoration will result in about 2051 fishing days increase in Osceola county
Using an estimated average spending/visit we also calculate ongoing annual economic and environmental impacts
19. 19 Assessing products (LCA) v/s local development initiatives IO approach is valuable since both economic and environmental impacts can be quantified.
Local effects and induced effects are important
Assessing direct effects and ongoing effects may be more complex
20. 20 Acknowledgement
This research was funded by grant from the Michigan Great Lakes Protection Fund.