Earnings per Share
120 likes | 317 Vues
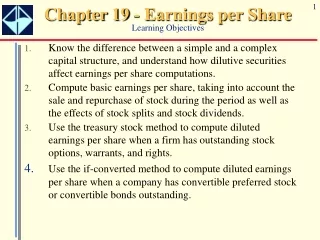
Earnings per Share. Earnings per Share. Financial statement users use earnings per share (EPS) to judge a company’s performance and to compare it with performance of other companies Shown on the income statement Shown for income from continuing operations Income before extraordinary items

Earnings per Share
E N D
Presentation Transcript
Earnings per Share • Financial statement users use earnings per share (EPS) to judge a company’s performance and to compare it with performance of other companies • Shown on the income statement • Shown for income from continuing operations • Income before extraordinary items • Cumulative effect of accounting change • Net income
2000 Earnings per share (basic) Income before extraordinary loss and cumulative effect of accounting change $4.69 Extraordinary loss -0- Cumulative effect of accounting change (.19) Net income $4.50
Basic EPS • Net income / weighted average of common shares outstanding • Example: EPS = $334,500/117,500 shares = $2.85 Weighted average: 100,000 shares x 3/12 = 25,000 120,000 shares x 6/12 60,000 130,000 shares x 3/12 32,500 117,500
Capital structures • Simple capital structure • No convertible bonds, stocks, or stock options • Complex capital structure • Convertible bonds, stocks, stock options (Potentially dilutive securities) • Potential dilution or possibility of conversion of these instruments creating more shares of stocks and diluting the EPS per stock • Diluted EPS – calculated by adding all potentially diluted instruments to the number of shares
Retained Earnings RE = Profits – Losses – dividends – transfers to contributed capital Restrictions on RE: Contractual - may restrict an amount that can be paid out for dividends State law – may not allow payment of dividends if reduces the equity level Board of Directors – may want an x amount in for future needs
Small Stock Dividend (less than 20-25% of a company’s oustanding stock) 30,000 x .10 = 3,0003,000 x $20 Market Price = $60,000 - $15,000 = $45,000 3,000 x $5 par value = 15,000 BeforeAfter Stockholders’ Equity: Common stock, $5 par, 30,000 shares issued $ 150,000 $150,000 Common stock distributable 3,000 shares 15,000 Additional paid-in cap. 30,000 75,000 Retained earnings 900,000 840,000 Total $1,080,000 $1,080.000 Total S/E is unchanged
Large Stock Dividend Example Stockholders’ Equity: Common stock, $10 par, 10,000 shares $ 50,000 $100,000 Additional paid-in cap. 30,000 30,000 Retained earnings 70,00020,000 Total $ 150,000 $150,000 BeforeAfter + - Dividend deducted from retained earnings and recorded in the Common Stock account at par. Additional Paid-In Capital account is unaffected.
Certificate of Stock Certificate of Stock $3 par value Certificate of Stock Certificate of Stock $1 par value Stock Splits • Results in additional issuance of shares • Reduces par value per share • No change in Stockholders’ Equity accounts
Disclose in notes Stock Splits • Not recorded in accounts • Splits reduce market value per share and make stock more affordable to a wider range of investors
2-for-1 Stock Split Example Stockholders’ Equity: Common stock, $10 par, 5,000 shares$ 50,000 Additional paid-in cap. 30,000 Retained earnings 70,000 Total $ 150,000 Before Split Assume Shah Company declares 2-for-1 stock split.
Only disclosures are affected All accounts are unchanged 2-for-1 Stock Split Example Stockholders’ Equity: Common stock, $5.00 par, 10,000 shares$ 50,000 $ 50,000 Additional paid-in cap. 30,000 30,000 Retained earnings 70,000 70,000 Total $ 150,000 $150,000 BeforeAfter