Enhancing Nontraditional CTE Participation: A Five-Step Accountability Process
This presentation by Mimi Lufkin, CEO of the National Alliance for Partnerships in Equity, at the CTEEC Conference in Tulsa, Oklahoma, outlines a systematic five-step process for improving performance and accountability in nontraditional Career and Technical Education programs. Key focus areas include understanding performance data, analyzing participation and completion rates, and addressing underrepresented demographics. The discussion highlights the need for thorough data analysis and benchmarking against best practices to enhance student engagement in high-skill occupations where gender disparity exists.

Enhancing Nontraditional CTE Participation: A Five-Step Accountability Process
E N D
Presentation Transcript
Improving Performance: The Five Step Process Mimi Lufkin: Chief Executive Officer National Alliance for Partnerships in Equity CTEEC Conference Tulsa, Oklahoma: September 17, 2009
Perkins Act Accountability Core Indicators on Nontraditional CTE • Participation in CTE programs preparing students for nontraditional fields • Completion of CTE programs preparing students for nontraditional fields
Nontraditional Fields Occupations or fields of work, including careers in computer science, technology, and other current and emerging high skill occupations, for which individuals from one gender comprise less than 25 percent of the individuals employed in each such occupation or field of work.
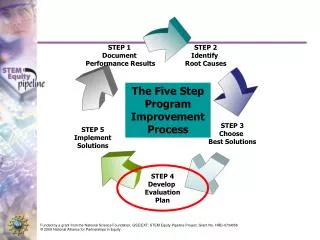
Document Performance Results GOAL: Understand the problem completely before you seek solutions How do you analyze performance data? What questions should be addressed? What tools and methods can be used to present and analyze data? How should data quality problems be considered in analyzing data?
Perkins Accountability Measure Participation Rate = # underrepresented students participating in NT CTE all students participating in NT CTE OR # of females enrolled in pre-engineering All students (males and females) enrolled in pre-engineering
Perkins Accountability Measure Completion Rate = # underrepresented students completing NT CTE all students completing NT CTE OR # of females completing pre-engineering All students (males and females) completing pre-engineering
Data CollectionDisaggregation required in Perkins IV Special Population • Underrepresented gender students in a nontraditional CTE program • Single Parent • Displaced Homemaker • Limited English Proficiency • Individuals with a Disability • Economically Disadvantaged • Gender • Male • Female • Race/Ethnicity • American Indian or Alaskan Native • Asian or Pacific Islander • Black, non-Hispanic • Hispanic • White- non-Hispanic
Recommended Analyses Trends • At least 2 years • Prefer 3-5 years • Site specific • Statewide • District • School/College • Programs
Benchmarking • State performance level • Best performer in state • National program benchmark • Selected peer benchmark • Set your own benchmark
Perkins Accountability Resources • Peer Collaborative Resource Network • www.edcountability.net • National Alliance for Partnerships in Equity • Growing Pains • Nontraditional SOC/CIP Crosswalk for Males and Females • www.napequity.org • Your State Agency Website
National Program Evaluations • Project Lead the Way • Annual Assessment Report for 2006-07 • Report 17% female enrollment nationally • Cisco Networking Academy Gender Initiative • Set a benchmark for programs at 30% female enrollment • National Center for Women in Information Technology • Report on the Status of Women in IT
Other Data Sources • National Center for Educational Achievement – Just 4 the Kids • National Center for Educational Statistics • Southern Regional Education Board Data Library • NCLB State and Local Report Cards • State and Local Participation and Achievement Data
Perkins Consolidated Annual Report Data State, School, and Program Level Analysis
Schools Included in “Statewide” Analysis • Caddo Kiowa Tech Center – Fort Cobb • Canadian Valley Tech Center – El Reno • Gordon Cooper Tech – Shawnee • Great Plains Tech Center – Lawton • Meridian Tech Center – Stillwater • Metro Tech – Oklahoma City • Moore Norman Tech Center – Norman • Red River Tech Center – Duncan • So. OK Tech Center – Ardmore • Tulsa Tech - Tulsa
Statewide Secondary and Adult Data • What does the data say or suggest? • How has state performed on the measure? • What happened to the results over time? • What questions arise from this data?
School Level Data • How has the school performed on the participation measure? • How has the college performed as compared to the state average on the measure? • What happened to the results over time? • What questions arise from this data?
State and School Secondary Nontraditional Program Participation
Program Level Data • What does the data say or suggest? • How has the state performed in each measure? • What happened to the results over time? • What questions arise from this data?
STEP TWO Identify Root Causes
Why Search for Root Causes? • Keep from fixating on the “silver bullet” strategy • Identify the conditions or factors that cause or permit a performance gap to occur • Two types of causes: • Direct cause (i.e. instructional practice) • Indirect cause (i.e. teacher training)
How to Identify Root Causes • Search for most direct & highest impact causes • Employ a systematic evidence-based process • Draw on current research and evaluation • Formulate and test theories or hypotheses • Use multiple methods and data sources • Note, you’re likely to find multiple causes
Phase 1: Identify Potential Causes • Review Research Literature • Review Program/Institutional Evaluations and Effectiveness Reviews • Conduct Focus Groups • Peer Benchmarking • Interviews & Surveys • Brainstorm