Download

1 / 85
990 likes | 1.72k Vues
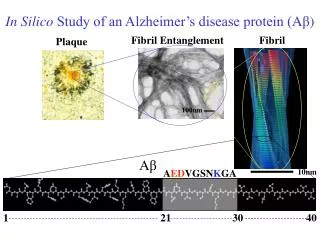
IVUS-VH & Vulnerable Plaque. Jang-Ho Bae, MD., PhD. Heart Center Konyang University Hospital Daejeon City, S. Korea. CAG 2004.9.2 Case (48/M), STEMI (ant). PCI 2004.9.2. Taxus Express 2, 3.0*24 mm, 10 atm. 6 months FU CAG (2005.3.21). STEMI at 27 months (2006.12.14). PCI 2006.12.14.

E N D
IVUS-VH & Vulnerable Plaque Jang-Ho Bae, MD., PhD. Heart Center Konyang University Hospital Daejeon City, S. Korea
PCI 2004.9.2 Taxus Express 2, 3.0*24 mm, 10 atm
PCI 2006.12.14 Guide wire Thrombectomy
Lumen volume 394.0 mm3 Vessel volume 959.5 mm3 Plaque Volume 565.5 mm3 Segment length 33.9 mm Fibrous volume 257.1 mm3 63% Fibro-fatty volume 50.8 mm3 12% Dense-calcium volume 25.7 mm35% Necrotic-core volume 77.8 mm3 19%
Contents • VP & TCFA • Fate of VP / intermediate lesion • Konyang experience with VP
Underlying Pathologies of Culprit Coronary Lesions (thrombotic coronary death and ACS) Ruptured plaques (~70%) Stenotic (~20%) Nonstenotic (~50%) Nonruptured plaques (~30%) Erosion Calcified nodule Others/Unknown Naghavi M. et al. Circulation 2003;108:1772-8
Vulnerable Plaque • Lesions are likely to rupture • Lesions composed of a lipid-rich core in the central portion of an eccentric plaque with a thin friable cap Muller et al. Ann Epidemiol 1992 Libby et al. Circulation1995
Pathologic Definition of VPIt can not be detectable in clinical practice Naghavi et al. Circulation 2003;108:1664-72 The Center of Vulnerable Plaque Research
“Vulnerable Plaque” = plaque not only prone to thrombosis/rupture but also at risk for rapidprogression 70% of ACS culprit lesions 30% of ACS culprit lesions Naghavi et al. Circulation 2003;108:1664-72 Gossl M et al. Med Clin N Am 2007;91:573-601
Thin Cap Fibroatheroma (TCFA) • Most common type of VP • Lesion at risk for rupture • Lesion that most resembles the acute plaque rupture • Area narrowing <75% (diameter stenosis <50%) in over 75% Fibrous Cap Lipid Core Intimal Inflammation >10% area of the plaque 3mm2 in 75% of case Length; 2-17mm (mean 8mm) <65 um Mean cap thickness+2SD of ruptured plaque Macrophage infiltration >25 cells/0.3mm diameter Virmani R et al. J Interven Cardiol 2003;16:267-72 Virmani R et al. JACC 2006;47:C13-8
Morphologic Variants of the TCFA Insignificant plaque burden Large eccentric necrotic core Large concentric necrotic core Healed rupture(s) Most common type Kolodgie FD et al. Curr Opin Cardiol 2001;16:285-92
New Methodologies to Detect VP • MRI • Coronary CT • Conventional gray-scale IVUS • Angiography • OCT • Thermography • VH-IVUS • NIR, …..
IVUS-RF Data Analysis • Plaque Classification Tree • Based on 8 spectral parameter • Maximum power • Corresponding frequency • Minimal power • Corresponding frequency • Slope • Y-intercept • Mid-band fit • Integrated backscatter ROI length480um Lumen EEM ROI width=124 scanlines (240 lines/frame) 64 samples along eachline 1 IVUS scan line
Tissue Characterization Media Densely packed collagen Fibrous Significant lipid in collagen Fibrofatty Calcium without necrosis Dense calcium Cholesterol cleft, foam cells, microcalcification Necrotic core
Examples in Tissue Characterization IVUS VH-IVUS Virmani VH Calcium = purple
Examples in Tissue Characterization IVUS VH-IVUS Virmani VH Calcium = purple
Predictive Accuracies of VH-IVUS Histology vs. RF data in gray IVUS Histology vs. VH-IVUS Fibrous Fibrofatty Calcified Necrotic core 2nd version in vivo (DCA) 87.1% 87.1% 96.5% 88.3% 2nd version ex vivo 93.5% 94.1% 95.8% 96.7% 1st version ex vivo 79.7% 81.2% 92.8% 85.5% Nair A. Circulation 2002;106:2200-6 Nasu K. J Am Coll Cardiol 2006;47:2405-12 Nair A. EuroInterv 2007;3:113-120
Lesion Classification Pathological intimal thickening Fibrocalcific lesion Fibrous cap atheroma Thin-cap fibroatheroma In at least 3 consecutive frames & PAV 40% Rodriguez-Granillo et al. Heart 2006;92:388-91
Cap thickness of TCFA • Axial resolution of IVUS-VH; 100-150um • 65um; based on autopsy and data of already ruptured plaque • Cap thickness <250um dramatically increases peak circumferential stress in the plaque Virmani R et al. J Interven Cardiol 2003;16:267-72 Schaar JA et al. Circulation 2003;108:2636-41
Contents • Definition of VP • Fate of VP / intermediate lesion • Konyang experience with VP
4 1 2 3 5 Proximal Ref. Distal Ref. 4 1 2 3 5 0 4 mm 10 mm 19 mm EEM CSA = 14.4 Lumen CSA = 8.9 Max Lumen dia = 3.6 MLD = 3.1 P+M CSA = 5.5 Plaque burden = 0.38 EEM CSA = 17.6 Lumen CSA = 4.1 ~ 4.3 P+M CSA = 13.1 Max Lumen dia = 2.5 MLD = 2.3 Plaque burden = 74% EEM CSA = 17.8 Lumen CSA = 12.2 Max Lumen dia = 4.2 MLD = 3.7 P+M CSA = 5.6 Plaque burden = 0.32
Lumen Volume 174.9 mm3 EEL Volume 361.3 mm3 Plaque Volume 186.4 mm3 Segment Length 19.7 mm Fibrous Volume 68.2 mm3 59% Fibro-Fatty volume 6.2 mm3 5% Dense Calcium Volume 11.7 mm3 10% Necrotic Core Volume 28.9 mm3 25%
Treatment in this patients ? EEM CSA = 17.6 Lumen CSA = 4.1 ~ 4.3 P+M CSA = 13.1 Max Lumen dia = 2.5 MLD = 2.3 Plaque burden = 74% Fibrous Volume 68.2 mm3 59% Fibro-Fatty volume 6.2 mm3 5% Dense Calcium Volume 11.7 mm3 10% Necrotic Core Volume 28.9 mm3 25% TCFA
Strategies in intermediate lesion • IVUS • FFR
IVUS MLA < 4.0mm2 357 intermediate lesion in 300 pts Clinical FU >1yr Any event (%) Revascularization (%) 2.0-2.9 N=17 3.0-3.9 N=36 5 N=193 4.0-4.9 N=55 2.0-2.9 N=17 3.0-3.9 N=36 5 N=193 4.0-4.9 N=55 Abizaid AS, et al, Circulation 1999
Deferral of PTCA Based on FFR • 325 patients referred for PTCA without documented ischemia • If FFR >0.75, randomized to Defer (91) or Performance (90) groups • If FFR <0.75, PTCA performed, Reference group (144) Patients free from angina (%) Bech et al, Circulation 2001
FFR > 0.80 as a cut-off value Gray zone of FFR by European PCI guideline ; FFR 0.75 ~ 0.80 Legalery et al, Eur Heat J 2005
Natural History of Intermediate Lesion • 10-yrs survival rate 90.1% vs. 85.8% (3342 pts with normal coronary vs. 2184 pts with noncritical stenosis (<70%) • Noncritical stenosis; not significant independent determinant of survival Crenshaw JH. et al. Am J Med Sci 1995
Evolution of Spontaneous Atherosclerotic Plaque Rupture With Medical TherapyIn 14 Pts with 28 plaque ruptures, 22 months FU 50% healed without significant plaque modification No healing-prediction criterion could be found Rioufol G. et al. Circulation 2004;110:2875-80
Angioscopic F/U of 50 Ruptured Plaques (30 pts) in Non-culprit Lesions; 13±9 Mo FU • Overall healing; 30% • Remaining of thrombi in 35 (70%) • Thrombus color change from red (56%) at baseline to pinkish-white (83%) at follow-up • %DS at the healed plaque (12.3% to 22.7%, p<0.05) • 1 pt need PCI DS=35% DS=43% Pinkish-white thrombus on the yellow plaque Smooth white intima without thrombus Ruptured plaques in nonculprit lesions tend to heal slowly with a progression of angiographic stenosis Takano M et al, J Am Coll Cardiol 2005;45:652– 8
Plaque instability frequently occurs days or weeks before occlusive coronary thrombosis Composition of the retrieved material using suction catheter in 211 pts undergoing 1 PCI within 6 hrs after onset of symptom Both components 45% 49 50 Only thrombus 54% 40 35 30 % 20 9 7 10 Only plaque components 5% 0 both <1day >5days Acute coronary occlusion is often the final Stage in a series of successive thrombotic Events that occurred in the preceding days or weeks 1-5 days Lytic Fresh & organized Fresh Organized van der Wal AC, Koch KT et al, TCT
Contents • Definition of VP • Fate of VP / intermediate lesion • Konyang experience with VP
Objectives VH-IVUS for detection a VP • To know clinical outcomes of intermediate lesion according to tissue type by VH-IVUS • To identify a lesion, which causes angina (needs PCI) in the future
Study Design • Patient population: • 30%-70% stenosis by CAG • Consecutive • Informed consent • Good quality of VH-IVUS Efficacy outcome measure: • Time to occurrence of a major CV event: • Lesion progression requiring PCI • Cardiac death • AMI • Fatal or nonfatal stroke • Any events Patients enroll CAG & VH-IVUS 98 lesions in 94 pts Clinical FU 64 pts (98.5%) 65 pts eligible Death n=3 FU loss n=1 98 lesions in 94 pts CAG & VH-IVUS FU 48 lesions (72.7%) 69 – 3 lesions eligible Jan 2007~Jun 2008 9 months 8.72.9 months
Patients Demographics (n=94) 61.811.8 68 (72.3) 43 (45.7) 27 (28.7) 35 (37.2) 37 (39.4) 42 (44.7) 5 (5.3) 78 (83.0) 0.581.22 Age, yrs Male, n (%) Hypertension, n (%) Diabetes, n (%) Smoking, n (%) Dyslipidemia, n (%) ACS, n (%) Prior MI, n (%) PCI, n (%) Hs-CRP, mg/dL
Angiographic Findings (n=98) Lesion location, n (%) LAD LCX RCA LM Diagonal Multi-vessel disease, n (%) MLD, mm Proximal ref. A diameter, mm Distal ref. A diameter, mm % diameter stenosis, % 53 (54.1) 20 (20.4) 15 (15.3) 8 (8.2) 2 (2.) 58 (59.2) 1.790.53 3.210.71 2.900.64 43.49.05 (30.0 ~ 66.2)
Gray Scale IVUS Findings (n=98) Minimal luminal area EEM area, mm2 Luminal area, mm2 P&M area, mm2 Plaque burden, % Remodeling index Positive remodeling (>1.05), n (%) Luminal area <4.0mm2, n (%) Volumetric analysis EEM volume, mm3 Lumen volume, mm3 P&M volume, mm3 Lesion length, mm 15.25.8 5.42.1 9.94.2 63.49.3 0.960.13 23 (23.5) 31 (31.6) 215.2128.1 97.554.2 116.380.5 13.97.2
IVUS-VH Findings at MLA (n=98) Fibrous area, mm2 Fibrofatty area, mm2 Dense calcified area, mm2 Necrotic core area, mm2 Fibrous area, % Fibrofatty area, % Dense calcified area, % Necrotic core area, % 3.952.29 0.921.17 0.530.52 1.170.96 60.214.1 12.19.7 9.18.6 18.711.5
TCFA by IVUS-VH • In at least three consecutive frames; • 1) necrotic core > 10% without evident overlying fibrous tissue and • 2) percent atheroma area > 40% Rodriguez-Granillo GA et al. JACC 2005;46:2038–42
TCFA Classification Less vulnerable Highest vulnerable NC > 20% > 50% Plaque burden Ca > 5% Remodeling index > 1.05 NC < 20% < 50% Plaque burden Proposed by Dr. Mintz G
IVUS-VH Findings at MLA (n=98) Undetermined (n=4, 4.1%) TCFA, less vulnerable (n=13, 46.4%) PIT (n=7,7.1%) TCFA (n=28, 28.6%) Fibrocalcific A (n=17, 17.3%) TCFA, high vulnerable (n=15, 53.6%) Fibrous cap A (n=42, 42.9%)
TCFA According to Diagnosis P=NS P=0.021 13 (30.2%) Highest vulnerable TCFA, % TCFA, % 10 (76.9%) 15 (27.3%) 5 (53.6%) (n=55) (n=43) (n=55) (n=43)
Medications (n=92 lesions) 98 (100) 61 (62.2) 46 (46.9) 15 (15.3) 25 (25.5) 73 (74.5) 20 (20.4) 2 (2.0) Aspirin Beta-blockers ACEI ARB CCB Statins OHA Insulin
6 Mo Clinical outcomes(64/65 pts, 98.5%) Death* Myocardial infarction Stroke Requiring PCI 3 (4.7%) 0 (0) 0 (0) 7 (10.9%) 8 lesions in 7 pts *; Causes of death; CHF at 1 month, ICH at 4 months, SCD at 5 months
Case, 강 0 준, SCD at 5 Mo 2007-07-30