Download
1 / 17
170 likes | 354 Vues
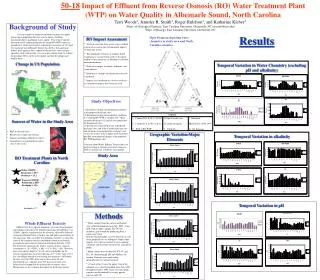
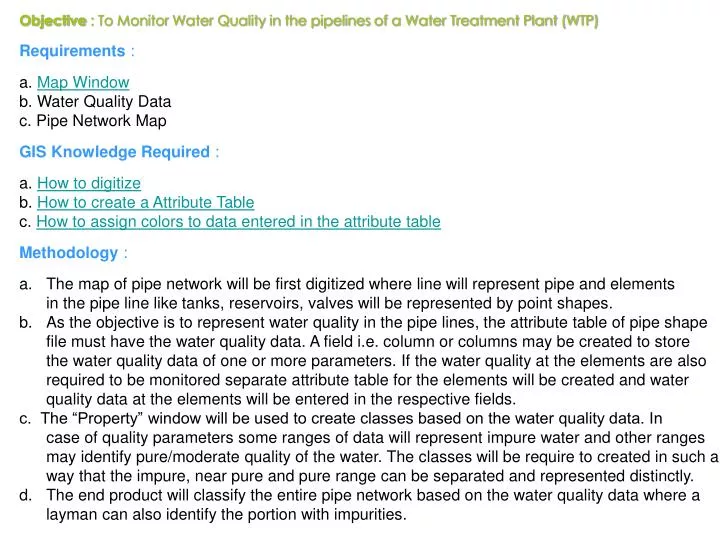
Objective : To Monitor Water Quality in the pipelines of a Water Treatment Plant (WTP) Requirements : a. Map Window b. Water Quality Data c. Pipe Network Map GIS Knowledge Required : a. How to digitize b. How to create a Attribute Table

E N D
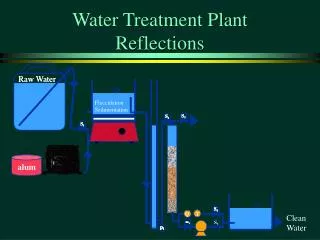
Objective : To Monitor Water Quality in the pipelines of a Water Treatment Plant (WTP) • Requirements : • a. Map Window • b. Water Quality Data • c. Pipe Network Map • GIS Knowledge Required : • a. How to digitize • b. How to create a Attribute Table • c. How to assign colors to data entered in the attribute table • Methodology : • The map of pipe network will be first digitized where line will represent pipe and elements • in the pipe line like tanks, reservoirs, valves will be represented by point shapes. • As the objective is to represent water quality in the pipe lines, the attribute table of pipe shape • file must have the water quality data. A field i.e. column or columns may be created to store • the water quality data of one or more parameters. If the water quality at the elements are also • required to be monitored separate attribute table for the elements will be created and water • quality data at the elements will be entered in the respective fields. • c. The “Property” window will be used to create classes based on the water quality data. In • case of quality parameters some ranges of data will represent impure water and other ranges • may identify pure/moderate quality of the water. The classes will be require to created in such a • way that the impure, near pure and pure range can be separated and represented distinctly. • The end product will classify the entire pipe network based on the water quality data where a • layman can also identify the portion with impurities.
Digitizing withMapwindow (www.mapwindow.org) • Setting the Coordinate System • Adding Image for Digitization • Drawing Shape file • Legend Editor and Attribute Table • Label Setup • Merge or Remove Shapes • MapWindowTM Important Icons • Other Icons
1.1.Setting The Coordinate System 1 File > Settings > Project Projection > Category/Group/Name 2 Category > Geographic/Projected/Custom 3 Show Mismatch Warnings ? > Yes (will show Mismatch warnings)/No (will hide mismatch warnings) 4 Use Projection Info ? > Yes (project will use the projection info for each file)/No (will not use the projection )
2.Adding Image for Digitization 1 Add the image. Image can be in any format (like : jpg,gif,tif..) 2 Click to create a new shape file. Name the shape file and select the location to save. Click Save to save the shapefile. Choose the shape file type i.e. point,line or polygon. 3 Click on the shp+ icon to start drawing shape files. Right click to finish drawing.
3.Drawing Shape files Half Drawn Shape file Picture of Map was Taken From : www.mapofindia.com
3.1.Selecting Types of Shape file Create point shape file for cities, stations, post office, village etc. Create line shape file for rivers, roads, telephone line etc. Create a polygon shape file for lakes, land use, big rivers etc.
3.2.Note 1 Point shape file will have different ids and different location reference (i.e. coordinates) 2 Line shape files have same id for all of its points but the first and last point of a line will always have different location reference (i.e. coordinates) 3 Polygon shape files have same id for all of its points and the first and last point of the polygon will always have the same location reference (i.e. coordinates) You can identify this difference if you open the attribute table and look at MWShape id field
4.Legend Editor & Attribute Table VIEWING THE CREATED SHAPEFILES IN LAYER MANAGER ADDING VALUES TO ATTRIBUTE TABLE NOTE : The map legend will be look like the Layer manager and can be exported by Edit>Export >Legend whereas the entire map can be exported as a jpg/bmp image by Edit >Export > Map Select Layer and Right Click to select Attribute Table Editor Various types of values can be added to the shapefile with the help of Attribute Table. Any information stored in this table can be visualized or represented in the map. The new shape files will be shown in the layer manager panel
4.1.Attribute Table 2 1 To Add New Fields i.e. columns to the table : Edit > Add Field, Select the data-type (string for text, integer for numbers, double for fraction number). Give a name and specify the field size. Click “Add” to add the field You can also select a field and zoom to it by using View > Zoom to Selected Shapes. You can use the “Selection” Menu to Query the table values or use the “Export Selected Shapes” menu to export the selected features Remember : Shapefiles consist shapes which are also called features)
4.2.Legend Editor CHANGING THE COLOUR,STYLE AND DIMENSION OF CREATED SHAPE FILE WITH PROPERTY > LEGEND EDITOR In Legend Editor window (select the shape file and click Properties) you can change the colour of the selected shape file; thickness of border of a polygon or thickness of a line shape file; transparency; vertex colour and size; line style; tool tip (when mouse is placed on the shape file the value of the file can be shown in the tool tip); legend picture (picture to be shown in the map legend) etc.
4.2.1.Creation of Coloring Schemes 2 1 Click + and assign MWShapeID. Change the colour by clicking on the colour box which will be shown under the “Color” column Click lightning icon to create continuous color ramps of single or double colour. Range can be specified by you or automatically created by MapWindow based on your data. and assigned MWShapeID. Change the colour by clicking on the colour box which will be shown under the “Color” column
4.2.1.Creation of Coloring Elevation - 2 4 3 Color Ramp is a ramp of colour from light to deep Different colours for different equal range of values can be assigned if you choose this option . Different colours for different values can be assigned if you choose this option .
5.Label Setup Field to Show in Label 2 1 Change the colour and alignment of the label Prepend or Append to the Label Change the Font Scale of the label And/or turn on/off Label Collision Avoidance
6.Merge or Remove Shape file 2 Remove shapes 1 Select Created Shapes 2 Merge two Shapes
7.Important Icons Open Old Project Print the Map Add New Project Measure Distance Between Two Points Zoom in or Out or Zoom to Full Extent Save the Project Add New Layers or Remove/Clear All Layers Measure Area by drawing a polygon Pan(move) the map Select a shape file within a layer. The layer must be active while selecting the shape-file
8.Other Icons Attribute table Measures the distance and area of the shape files under the selected layers. Starts to create a shapefile Identifier i.e. click on any shapefile after selecting this icon to know the information stored into that shape file Move Vertices Add(+) or Remove(-) Vertices Create a new type of shape file. Often called as Shape file container Click to Remove Selected Shape file Merge two or more shapefiles of same type