Download

1 / 24
240 likes | 260 Vues
Using Matrices to Predict Growth. The Leslie Model. Competency Goal and Objective. NC Competency Goal 1: The learner will use matrices and graphs to model relationships and solve problems Objective 1.01: Use matrices to model and solve problems. Display and interpret data.

E N D
Using Matrices to Predict Growth The Leslie Model
Competency Goal and Objective • NC Competency Goal 1: The learner will use matrices and graphs to model relationships and solve problems • Objective 1.01: Use matrices to model and solve problems. • Display and interpret data. • Write and evaluate matrix expressions to solve problems.
The Leslie Model • The Leslie matrix (also called the Leslie model) is one of the best known ways to describe the growth of populations (and their projected age distribution), in which a population is closed to migration and where only one sex, usually the female, is considered.
Leslie Model as Ecology Tool • The Leslie Matrix is used in ecology to model the changes in a population of organisms over a period of time. In a Leslie Model, the population is divided into groups based either on age classes or life stage. At each time step the population is represented with an element for each age classes where each element indicates the number of individuals currently in that class.
Rattus norvegicus Example • Let’s consider the growth rate of a population of small brown rats, Rattus norvegicus. • Life span is 15 to 18 months. • First litter at 3 months and continue to reproduce every 3 months until they reach 15 months old.
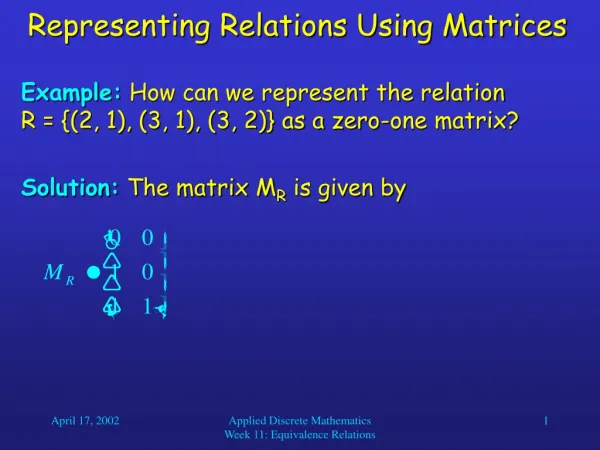
Table 1 gives birthrates and age-specific survival rates. Assume, birthrates and survival rates remain constant over time, and consider only the female population. Data
Number of Female Births • To calculate the actual number of female births in a particular age group, we must multiply the birthrate by the number of females in the group. • The original female rodent population is 42 animals with the following age distribution.
New Births After One Cycle • We can find the number of new births, after one cycle by multiplying the number of females by the corresponding birthrates and then finding the sum: 15(0) + 9(0.3)+13(0.8)+5(0.7)+0(0.4)+0(0) =0+2.7+10.4+3.5+0+0 =16.6 • Therefore, the # of females in the 0-3 age group after 3 months is about 17.
Survival Rates After 3 Months • The survival rate is the number of rodents that survive in each age group and move up to the next. • To find the number of rodent who survive, multiply the number in each age group, by the survival rate.
Population Size After 3 Months • Thus, after 3 months the female population has grown from 42 to approximately 50, with the distribution that follows:
Population After 6 Months • To calculate the female rodent population after 6 months (two cycles), this process can be repeated using the numbers from the last table.
Practice Questions • Leslie Model Questions.doc
Advantages of Leslie Model • We can see that doing the arithmetic for successive cycles becomes somewhat cumbersome. • That is why the Leslie Model has become more increasingly used.
Matrix Problem Conversion • We can calculate the population distribution at the end of the first cycle (P1) using two matrices: the original population distribution (P0) and a matrix L.
The Leslie Matrix • The matrix L is called the Leslie matrix. It is formed by augmenting, or joining the column vectors containing the birthrates of each age group and a series of column vectors that contain the survival rate as one entry and zeroes everywhere else.
Number Placement in the Leslie Matrix • Notice that the survival rates lie along the superdiagonal, that is immediately above the main diagonal of the matrix. Superdiagonal
Total Population after 3 months • Total population = 16.6+9.0+8.1+11.7+4.0+0+0= =49.4
Population Distribution • When matrix L is multiplied by a population distribution Pk, a new population distribution Pk+1 results. To find the population distributions at the end of other cycles, the process can be continued. P1= P0L P2 = P1L= (P0L)L= P0(LL)= P0L2 • In general, Pk = P0Lk
Population Distribution after 24 months • Using this formula we can find the population distribution for the rodents after 24 months (eight cycles) and the total population of the rodents we have
Total Population after 24 months • Total population = Or, approximately 65 rodents.
Practice Problems • Leslie Questions#2.doc