Download
1 / 29
290 likes | 428 Vues
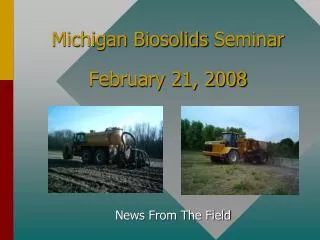
MWEA Lagoon Conference February 21, 2013 Frankenmuth, Michigan. Show Me The Data Effectiveness and Measurement of Chemical Use Jeff Grames & Bill Soper NuSystems, Inc. Agenda. Who is NuSystems What is ReNew? What happens in a lagoon... Review of case studies Summary. Who Is NuSystems?.

E N D
MWEA Lagoon ConferenceFebruary 21, 2013Frankenmuth, Michigan Show Me The DataEffectiveness and Measurement of Chemical UseJeff Grames & Bill SoperNuSystems, Inc.
Agenda Who is NuSystems What is ReNew? What happens in a lagoon... Review of case studies Summary
Who Is NuSystems? NuSystems is located in Bay City, Michigan serving customers throughout the Midwest. We perform our services in Wastewater Treatment, Industrial Processing, Institutional Applications and the Paper Industries. We support Environmental Management Systems (EMS), and quality programs such as ISO 14000 and Good Manufacturing Practices (GMP). We provide life science chemistry based solutions for municipal and industrial applications from air scrubbers to waste treatment processes. Our technology focus is pH neutral chemistries that work to eliminate odors, reduce COD/BOD, breakdown Suspended Solids, Fats, Oils and Grease which provides a more treatable waste for downstream processes. 3
What is ReNew? NuSystems is the original developer of the technology.
The ReNew Product Family Air Water Cleaning Hydrogen Sulfide Treatment for Sewer Systems Municipal Lagoon Treatment Food & Beverage Processor Wastewater Treatment Silicone-based Product & Open Plant Cleaning Odor Remediation; Industrial, Air Scrubbers, CAFOs Cooling Tower Treatment Fats, Oils, & Grease Cleaning for Sewer Systems, Lift Stations, & Drains
Aerobic Respiration – The Role of Oxygen Municipal Waste + Bacteria + Oxygen CO2 + Bacteria Two pounds oxygen per pound BOD Compressed air or electric aerators. WWTP budgets are typically 30% for power. Lagoons use less power and more time.
Oxygen Sources in Municipal Lagoons • Biological (algae) • Mechanical (aerators, diffusers) • Atmospheric Diffusion (wind) Algae Oxygen
Photosynthesis and RespirationAlgae + CO2 + Sunlight More Algae + Oxygen + Carbonate • Biomass increases nutrient uptake ( P, N ). • Bacterial respiration decreases organic waste (C) • ReNew allows algae to produce more oxygen. Carbon Dioxide Pollutants Algae Bacteria Oxygen
Lagoon Cost Components Power Treatment Chemicals Sludge Removal Odor Complaints / Lawsuits Regulatory Compliance
Lagoon Bio-chemical Changes Treatment Program: Spike dose applications of Odor Out at 5 ppm initially for immediate biological & odor improvement. Continual feed of Hydro Zyme @ 3-6 ppm into influent. Measurables that will quickly impacted. Increase Dissolved Oxygen Increase Oxidation Reduction Potential Increase pH Decrease turbidity
Value Proposition Near future (present to 6 months) Reduced Odor Reduced Power (if aerated) Reduced Chemical Addition Improved D.O. Long term (6 months to 1 year) Reduced Sludge Layer Reduced Green House Gas Emissions Steady Improvement in Effluent Quality Clarification of water allows algae to produce more oxygen
Data and Methodology: In order to understand the affects of candidate treatment technologies we must safely collect surface and subsurface water quality data before and after treatment. There are numerous variables that can affect the data like rain, sunlight, temperature, volume flow rate changes, and fluctuations in organic load. The equipment shown here is used to collect, Dissolved Oxygen, Oxidation Reduction Potential, Total Suspended Solids, pH, Conductivity, and chlorophyll content. This information is used to better understand the performance of the untreated lagoon, and to make decisions on the viability of various treatment options. Unmanned Research Vessle Sludge Mapping Sensor monitoring and data logging Laboratory Pond Cloning
Oscoda, Michigan Process Design- Oscoda Twp WW Lagoons • 0.2 MGD Influent • Cell 1 is heavily aerated • Alum to cell 2 @ 40 lbs/Day • 2 Solar mixers Cell 2 • Regulatory pressure on N and P 200 ft Cell 3 3.74 Acre 11.67 MG Cell 2 4 Acre 14.7 MG Cell 1 1.04 Acres 2.85 MG 875 ft
Oscoda June 28, 2011 Cell 2
Oscoda June 28, 2011 Cell 2
Oscoda July 13, 2011 Cell 2
Oscoda August 1, 2011 Cell 2
Antwerp, Ohio Lagoon System N Cell One Cell Two Cell Three
Total Cost to Operate – Treatment ChemicalsWinamac, Indiana ReNew Start Before ReNew 158 mg/l $30,000/yr After ReNew 91 mg/l $17,000/yr Annual Savings = $13,000 Plus electrical savings for turning off aerators.
Village of – NuSystems Lagoon Program Results • Primary issues regarding the wastewater lagoons: • Sludge: Sludge removal cost for cells 1&2 was approximately $300,000.00 plus. The NuSystems Lagoon Treatment Program reduced the sludge 25% in the first year. This is a reduction of approximately $75,000.00 in removal costs. • H2O/Odor: Community odor complaints averaged five or six per year. For the years ending 2011 and 2012, there were 0 complaints. • Aeration costs: Two aerators were in operation with a cost of $1,500.00 per month, excluding man hours for maintenance and repair. Three months after the beginning of the NuSystems technology implementation, the aerators were decommissioned and the dissolved oxygen numbers increased. • Parameters: 2009 2012 • BOD 50 11 • TSS 70 26 • DO 07.9 14 • Amm02.18 01.00 • Phos03.84 01.23
Village of – NuSystems Lagoon Program Results • Primary issues regarding the wastewater lagoons: • Sludge: Sludge removal for the Village of was to be 25% greater than average due to high metal content within the sludge. The sludge blanket has been reduced 10% annually since 2009 with the NuSystems Lagoon technology. • Odor Control: Before the NuSystems technology was implemented, was experiencing extensive odor issues on cell #1 and the main lift station in town. After a week of implementation, all odors were gone. There was also no odor at turn over time in the spring. • Parameters: Before NuSystems After NuSystems • BOD 02.4 02.3 • DO 09.25 12.4 • Amm06.7 00.69 • Phos04.9 01.54 • Fecal Coliform 76 10
Summary Hard data in Lagoon enhancement has been scarce Claims for performance improvements have been many Operators have been justifiably skeptical Data gathering is expensive and necessarily site specific Best data sets combine laboratory, controlled field and actual operating data from a variety of Lagoon operations Decision to accept an enhancement program must be based on scientific data, field experience and value to the community