
SNP-VISTA: AN INTERACTIVE SNPs VISUALIZATION TOOL
E N D
Presentation Transcript
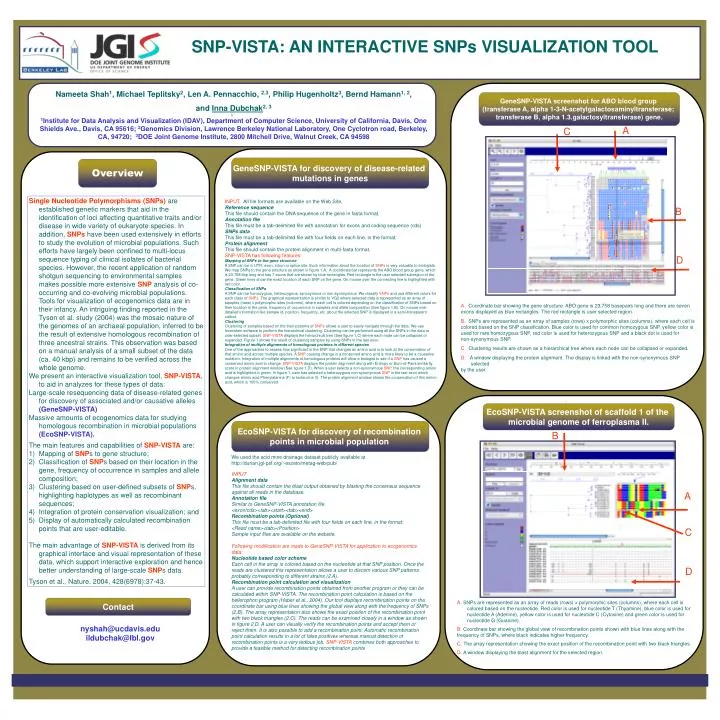
SNP-VISTA: AN INTERACTIVE SNPs VISUALIZATION TOOL b Nameeta Shah1, Michael Teplitsky2, Len A. Pennacchio, 2,3, Philip Hugenholtz3, Bernd Hamann1, 2, and Inna Dubchak2, 3 1Institute for Data Analysis and Visualization (IDAV), Department of Computer Science, University of California, Davis, One Shields Ave., Davis, CA 95616; 2Genomics Division, Lawrence Berkeley National Laboratory, One Cyclotron road, Berkeley, CA, 94720; 3DOE Joint Genome Institute, 2800 Mitchell Drive, Walnut Creek, CA 94598 GeneSNP-VISTA screenshot for ABO blood group (transferase A, alpha 1-3-N-acetylgalactosaminyltransferase; transferase B, alpha 1.3.galactosyltransferase) gene. A C GeneSNP-VISTA for discovery of disease-related mutations in genes Overview • Single Nucleotide Polymorphisms (SNPs) are established genetic markers that aid in the identification of loci affecting quantitative traits and/or disease in wide variety of eukaryote species. In addition, SNPs have been used extensively in efforts to study the evolution of microbial populations. Such efforts have largely been confined to multi-locus sequence typing of clinical isolates of bacterial species. However, the recent application of random shotgun sequencing to environmental samples makes possible more extensive SNP analysis of co-occurring and co-evolving microbial populations. Tools for visualization of ecogenomics data are in their infancy. An intriguing finding reported in the Tyson et al. study (2004) was the mosaic nature of the genomes of an archaeal population, inferred to be the result of extensive homologous recombination of three ancestral strains. This observation was based on a manual analysis of a small subset of the data (ca. 40 kbp) and remains to be verified across the whole genome. • We present an interactive visualization tool, SNP-VISTA, to aid in analyzes for these types of data: • Large-scale resequencing data of disease-related genes for discovery of associated and/or causative alleles (GeneSNP-VISTA) • Massive amounts of ecogenomics data for studying homologous recombination in microbial populations (EcoSNP-VISTA). • The main features and capabilities of SNP-VISTA are: • Mapping of SNPs to gene structure; • Classification of SNPs based on their location in the gene, frequency of occurrence in samples and allele composition; • Clustering based on user-defined subsets of SNPs, highlighting haplotypes as well as recombinant sequences; • Integration of protein conservation visualization; and • Display of automatically calculated recombination points that are user-editable. • The main advantage of SNP-VISTA is derived from its graphical interface and visual representation of these data, which support interactive exploration and hence better understanding of large-scale SNPs data. • Tyson et al., Nature. 2004, 428(6978):37-43. INPUT. All file formats are available on the Web Site. Reference sequence This file should contain the DNA sequence of the gene in fasta format. Annotation file This file must be a tab-delimited file with annotation for exons and coding sequence (cds) SNPs data This file must be a tab-delimited file with four fields on each line, in the format: Protein alignment This file should contain the protein alignment in multi-fasta format. SNP-VISTA has following features: Mapping of SNPs to the gene structure A SNP can be in UTR, exon, intron or splice site. Such information about the location of SNPs is very valuable to biologists. We map SNPs to the gene structure as shown in figure 1.A. A coordinate bar represents the ABO blood group gene, which is 23.758 kbp long and has 7 exons that are shown by blue rectangles. Red rectangle is the user selected subregion of the gene. Green lines show the exact location of each SNP on the gene. On mouse over the connecting line is highlighted with red color. Classification of SNPs A SNP can be homozygous, heterozygous, synonymous or non-synonymous. We classify SNPs and use different colors for each class of SNPs. The graphical representation is similar to VG2 where selected data is represented as an array of samples (rows) x polymorphic sites (columns), where each cell is colored depending on the classification of SNPs based on their location in the gene, frequency of occurrence in samples and allele composition (See figure 1.B). On mouse over detailed information like sample id, position, frequency, etc. about the selected SNP is displayed in a semi-transparent callout. Clustering Clustering of samples based on the their patterns of SNPs allows a user to easily navigate through the data. We use levenstein software to perform the hierarchical clustering. Clustering can be performed using all the SNPs in the data or user-selected subset. SNP-VISTA displays the hierarchical tree (See figure 1.C) where each node can be collapsed or expanded. Figure 1 shows the result of clustering samples by using SNPs in the last exon. Integration of multiple alignments of homologous proteins in different species One of the approaches to assess how significant is the SNP that changes an amino acid is to look at the conservation of that amino acid across multiple species. A SNP causing change in a conserved amino acid is more likely to be a causative mutation. Integration of multiple alignments of homologous proteins will allow a biologist to see if a SNP has caused a conserved amino acid to change. SNP-VISTA displays the protein alignment along with Entropy or Sum-of-Pairs similarity score in protein alignment window (See figure 1.D). When a user selects a non-synonymous SNP, the corresponding amino acid is highlighted in green. In figure 1, user has selected a heterozygous non-synonymous SNP in the last exon which changes amino acid Phenylalanine (F) to Isoleucine (I). The protein alignment window shows the conservation of this amino acid, which is 100% conserved. B D A. Coordinate bar showing the gene structure. ABO gene is 23,758 basepairs long and there are seven exons displayed as blue rectangles. The red rectangle is user selected region. B. SNPs are represented as an array of samples (rows) x polymorphic sites (columns), where each cell is colored based on the SNP classification. Blue color is used for common homozygous SNP, yellow color is used for rare homozygous SNP, red color is used for heterozygous SNP and a black dot is used for non-synonymous SNP. C. Clustering results are shown as a hierarchical tree where each node can be collapsed or expanded. D. A window displaying the protein alignment. The display is linked with the non-synonymous SNP selected by the user. . EcoSNP-VISTA screenshot of scaffold 1 of the microbial genome of ferroplasma II. EcoSNP-VISTA for discovery of recombination points in microbial population B We used the acid mine drainage dataset publicly available at http://durian.jgi-psf.org/~eszeto/metag-web/pub/ INPUT Alignment data This file should contain the blast output obtained by blasting the consensus sequence against all reads in the database. Annotation file Similar to GeneSNP-VISTA annotation file. <exon/cds><tab><start><tab><end> Recombination points (Optional) This file must be a tab-delimited file with four fields on each line, in the format: <Read name><tab><Position> Sample input files are available on the website. Following modification are made to GeneSNP-VISTA for application to ecogenomics data: Nucleotide based color scheme Each cell in the array is colored based on the nucleotide at that SNP position. Once the reads are clustered this representation allows a user to discern various SNP patterns probably corresponding to different strains (2.A). Recombination point calculation and visualization A user can provide recombination points obtained from another program or they can be calculated within SNP-VISTA. The recombination point calculation is based on the bellerophon program (Huber et al., 2004). Our tool displays recombination points on the coordinate bar using blue lines showing the global view along with the frequency of SNPs (2.B). The array representation also shows the exact position of the recombination point with two black triangles (2.C). The reads can be examined closely in a window as shown in figure 2.D. A user can visually verify the recombination points and accept them or reject them. It is also possible to add a recombination point. Automatic recombination point calculation results in a lot of false positives whereas manual detection of recombination points is a very tedious job. SNP-VISTA combines both approaches to provide a feasible method for detecting recombination points A C D A. SNPs are represented as an array of reads (rows) x polymorphic sites (columns), where each cell is colored based on the nucleotide. Red color is used for nucleotide T (Thyamine), blue color is used for nucleotide A (Adenine), yellow color is used for nucleotide C (Cytosine) and green color is used for nucleotide G (Guanine). B. Coordinate bar showing the global view of recombination points shown with blue lines along with the frequency of SNPs, where black indicates higher frequency. C. The array representation showing the exact position of the recombination point with two black triangles. D. A window displaying the blast alignment for the selected region. Contact nyshah@ucdavis.edu ildubchak@lbl.gov