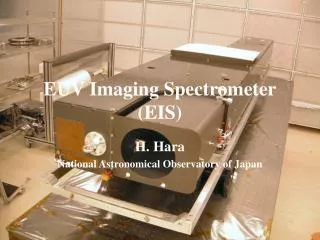
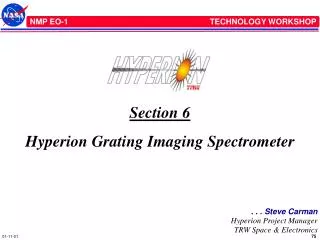
Section 6 Hyperion Grating Imaging Spectrometer
Section 6 Hyperion Grating Imaging Spectrometer. . . . Steve Carman Hyperion Project Manager TRW Space & Electronics . Outline. Driving Requirements Design Overview Performance Requirements Calibration/Characterization Flight Validation. Hyperion Driving Requirements.

Section 6 Hyperion Grating Imaging Spectrometer
E N D
Presentation Transcript
Section 6 Hyperion Grating Imaging Spectrometer . . . Steve Carman Hyperion Project Manager TRW Space & Electronics
Outline • Driving Requirements • Design Overview • Performance Requirements • Calibration/Characterization • Flight Validation
Hyperion Driving Requirements . . . Steve Carman Hyperion Project Manager TRW Space & Electronics
Purpose of Hyperion on EO-1 • Hyperion is the first hyperspectral imager in space, demonstrating this new technology • Hyperion will set the standard for hyperspectral imagery, enabling NASA to establish minimum requirements for future data buy • Hyperion FOV is coaligned with ALI’s active area to enable cross-calibration of earth scenes with complete spectrum • Discrete channels on Landsat and ALI can be checked with Hyperion • Comparison with Terra MODIS and ASTER also planned • Hyperion satisfies NASA’s desire to replace the Hyper-Spectral Imager (HSI) that was lost with the Lewis mission. • This new technology can provide unique insight into many scientific and commercial disciplines
Hyperspectral Imaging Applications & Benefits Existing Satellite Capabilities (SPOT, Application LandSat) Hyperion Capability Perceived Benefits Mining/Geology Land cover classification Detailed mineral Accurate remote mineral mapping exploration Forestry Land cover classification Species ID Forest health/infestations Detail stand mapping Forest productivity/yield Foliar chemistry analysis Tree stress Forest inventory/harvest planning Agriculture Land cover classification Crop differentiation Yield prediction/commodities Limited crop mapping Crop stress crop health/vigor Soil mapping Environmental Resource meeting Chemical/mineral Contaminant MappingManagement Land use monitoring mapping & analysis Vegetation Stress
Hyperspectral and Multispectral Scene Characterization Hyperspectral Imaging Hundreds of bands Measured Reflectance Spectral characteristic of scene Wavelength Reflectance Band 4 Band 3 Wavelength Measured Reflectance Band 2 Multispectral Imaging Few bands Band 1 Wavelength
Hyperspectral Image Provides Forestry Detail LandSat Analysis Hyperspectral Analysis Legend No Data Hemlock/ Open field Hardwood Mix Red Maple Mixed Conifer Red Oak Norway Spruce Mixed Hardwood Red Pine Hardwood/ Spruce Swamp Conifer Mix White Pine Hardwood Bog Analysis by Mary Martin University of New Hampshire
Hyperspectral Image Provides Geological Data GEOTHERMALAREA (no specific mineral information) CALCITE (gold bearing quartz) Red: Calcite Blue and Green: Muscovite MULTISPECTRAL ANALYSIS HYPERSPECTRAL ANALYSIS Red: Hydro-thermal alteration Analysis courtesy AIG Limited Liability Company
Roof Analysis and Mapping Project - Redondo Beach Middle Schools Objective: Provide detailed map of roof composition clusters for Redondo Beach, CA fire department Roof Composition Analysis Using Hyperspectral Data Aerial Photo Asphalt1 Asphalt 2 Asphalt 3 Wood Tile
Hyperion Hyperspectral Imager Hyperion Sensor Assembly before Environmental Test (5/6/99) • Hyperion is a push-broom imager with: • 220 10 nm bands covering the spectrum from 0.4 mm - 2.5 mm • 6% absolute radiometric accuracy • Image swath width of 7.5 km • IFOV of 42.5 mrad • GSD of 30 m at 705 km altitude • 12-bit image data • MTF 0.34 - 0.48 • Power: 51W orbit avg., 126W peak • Mass: 49 kg Hyperion 12 months from order to delivery
Hyperion Origins • Following contract termination of planned Grating Imaging Spectrometer (GIS) and Wedge Imaging Spectrometer (WIS) due to technical problems, TRW offered to build Hyperion, a hyperspectral GIS integrated with the Advanced Land Imager (ALI), to be assembled from Lewis Hyperspectral Imager (HSI) spares and delivered to EO-1 in just 12 months • Hyperion instrument redefined in first week of project as a stand-alone instrument to simplify EO-1 integration by eliminating integration with ALI • Added foreoptics and structure design based on spares from the Electro Optical Camera (EOC), another TRW instrument program • Schedule remained 12 months to delivery • Even with a tight one-year schedule, the EO-1 quality requirements and technical design reviews were fully incorporated into the Hyperion program
1998 1999 Activity Name May Jun Jul Aug Sept Oct Nov Dec Jan Feb Mar Apr May Jun Jul Project Milestones Pre-Ship Conf. Design Start L-11 CoDR CDR Pre-Env Review Rvw. Thermal Reviews Mo. Test 6/30 4/20 CDR Instrument Need Date EO-1 Review Review 7/14 Delta Cryocooler Assembly CDR Cryocooler Electronics Design Procurement Fab/Assy/Test Test Set Cryocooler Mechanical Assembly Procurement Fab/Assy/Test May Jun Jul Aug Sept Oct Nov Dec Jan Feb Mar Apr May Jun Jul Hyperion Master Schedule Even though Hyperion was an extremely fast-paced program, the parts selection and design standards were not compromised. Hyperion met the GSFC/EO-1 program quality requirements, including numerous reviews. 7 Oct 1998 VNIR Focal Plane Electronics (FPE) Design Procurement Fab/Assy/Test Electronics Assembly (HEA) Design Procurement Fab/Assy/Test Software Optical-Mechanical Subsystem (OMS) ... Instrument Test Set (HITS) Design Procurement Fab/Assy/Check-out Hyperion Software Shipped System Mechanical Design 6 July 99; System Mechanical Fabrication Delivered System Assembly & Test 7 July 99 Instrument Assembly Instrument Test Pack & Ship
Key System Trades & Critical Analyses • Dichroic Beam Splitter Vs. Dual Blazed Grating • Selected Dichroic separation of VNIR and SWIR requiring two gratings, improving performance over dual blazed grating • Instrument Spectral Bandwidth • Trade to maximize signal-to-noise ratio by optimizing the 10nm spectral width and the number of channels • Thermal Control of Opto-Mechanical Structure • Moved heaters from outside of honeycomb enclosure to the OMS structure inside honeycomb enclosure to save heater power. • 1553 / 1773 Conversion • Selected transceiverless 1553 chip that matched input to EO-1 1773 fiber optic device, avoiding significant expense of developing a separate converter
Hyperion Design Overview . . . Steve Carman Hyperion Project Manager TRW Space & Electronics
Hyperion Functional Block Diagram Aperture Cover Hyperion Electronics Assembly Actuator Hyperion Sensor Assembly (HSA)
Hyperion Subassemblies Hyperion Electronics Assembly (HEA) Cryocooler Electronics Assembly (CEA) Hyperion Sensor Assembly (HSA)
Hyperion Electronics Assembly (HEA) Cryocooler Electronics Assembly (CEA) Hyperion Sensor Assembly (HSA) Hyperion Spacecraft Accommodation HSA, HEA and CEA locations on the EO-1 nadir deck
Hyperion Performance Requirements . . . Steve Carman Hyperion Project Manager TRW Space & Electronics
Hyperion Mission Requirement EQ7-0459 Hyperion NMP EO-1MAR D27445 Interface Control Document IF1-0228 Requirement Flow Down Hyper-300-98-001 Operations Project Quality Req’ts QPR24662 Hyperion S/C Layout A0743 Hyperion Specification EQ7-0459 Validation Plan Project Approved Part List D27443 S/C Hyperion ICD Drawing A0765 Operation Manual HSA CI No. CHA0100 Dwg TBD Opto-Mechanical Subsystem Spec EQ7-0457 HEA CI No. CHA0200 Dwg 868590 Cryocooler Test Plan Calibration Plan • Functional Test Procedure • Performance Test Procedure • Calibration Procedure • Vibration Test Procedure • TV Test Procedure • EMC Test Procedure • End Item Data Package • Grating Spec EQ7-0458 • Dichroic Spec EQ7-0460 • VNIR O-Filter EQ7-0371 • SWIR O-Filter EQ7-0369 • VNIR FPA Spec EQ2-0272 • SWIR FPA Subsystem • L513.DI.94-259 Rev. D CEA CI No. CHA0300 Dwg. 868650 Pulse Tube Ass’y CI No.CHA0400 Dwg. TBD Hyperion Requirements Flowdown
Hyperion Performance Requirements Signal to Noise Ratio (SNR) Modulation Transfer Function (MTF)
Hyperion Calibration/Characterization . . . Peter Jarecke Hyperion Calibration TRW Space & Electronics
FPA Rectilinearity Cross-Track Spectral Alignment (CTSA) Spatial Co-Registration of Spectral Channels (SCSC) Image Quality Cross-track and Along-track MTF Radiometric Responsivity - Calibration Long Term Repeatablity Pixel Center Wavelength Calibration Signal to Noise Ground Sample Distance and Swath Width Radiometric Quantities To Be Characterized
Overview of Calibration Process Filters Precision Aperture FEL Lamp QED-150 Ammeter Spectralon Panel SPR-73 V and I Standards ECPD Chopper
Conversion to Radiance Footprint on Spectralon Panel ± 7° AOI from normal to limits of the Hyperion sensor footprint ASD data taken at 5 points transverse to Hyperion view with 5° FOV field limiter Hyperion 12.5 cm Aperture 0.43 degree FOV views Spectralon at an AOI of 26° View Angle of Hyperion varies from 19° to 33° from specular off Panel FEL Lamp FEL Incident Irradiance falls as cos³ of the AOI which is a 2.5 % falloff in Irradiance The BRDF characteristics of the Panel are critical in converting FEL Irradiance incident on the Panel to Radiance. The assumption that the BRDF is flat from 19° to 33° based on vendor data was tested using an ASD Field Spec as shown. ASD data matched the 2.5 % falloff to ± 0.3 %
Spectralon Panel Assembly Installed Chamber Window Covered Black Panel Over White Chamber Wall Back of Spectralon Panel FEL 1000 Watt Lamp Gold Plated Baffle
Hyperion Radiometric Characterization Facility Monochrometer Transfer Radiometer OAP Detector QTH Lamp Light Pipe Housing Precision Pinhole Fold Spectralon Mirror Panel Precision OAP Aperture Steering Mirror Formerly Known as the MSTB - Upgraded for Hyperion Characterization Two modes of Operation: 1) Pinhole, slit and/or Knife Edge at end of light pipe put at focus of OAP 2) End of light pipe is re-imaged onto Spectralon panel. Both are shown simultaneously in chart without re-imaging optics Steering mirror is a two axis, fine pointing mirror ( ±1-2 mrad) for sub-pixel scanning in spatial dimensions Chopper The transfer radiometer is a removable box for calibration of the Characterization Facility output. It uses a chopped pyroelectric detector traceable to the TRW primary irradiance scale. An accurate AW is calculated from precision apertures and OAP focal length.
Spectral Wavelength Calibration • High resolution scans of the Holmium and Erbium Oxide doped Spectralon are shown in the next chart. • Two sensor data frames are taken: one from a doped Spectralon panel and one from a high reflectance Spectralon panel. • The ratio of these two frames removes lamp illumination source wavelength variations and sensor response variations. • To derive a calculated curve for the above data, the high resolution scans are convolved with the sensor spectral response function. This degrades the high resolution scans to the lower sensor resolution. • A linear least squares (LLS) regression of the data points with the curve fixes the wavelength calibration of the sensor. Each spatial FOV position is calibrated in wavelength simultaneously for all spectral pixels saving time greatly. • The linear regression at each FOV position allows three constants for wavelength values at the pixel center (i.e. a second order fit in l versus pixel number). The width of the sensor pixel response function is also allowed to take on a best fit value for the LLS. • The accuracy of the fit is about 0.02 pixels (judgement call based on the width of the standard error minimum of the LLS fit)
Reflectance Spectra of Doped Spectralon 1.6 1.4 1.2 Erbium (offset by 0.5) Reflectivity 1.0 Holmium 0.8 0.6 0.4 200 400 600 800 1000 1200 1400 1600 1800 2000 Wavelength (nm) 0.600 0.500 0.400 Reflectivity 0.300 0.200 VNIR measurement 0.100 Model calculation (LLS fit with 4 parameters) 0.000 300 500 700 900 1100 Wavelength (nm) Spectral Wavelength Calibration
Image Quality Example Vertical and Horizontal MTF can be calculated from diagonal edge
Spectral Calibration Using Internal Calibration System Examples of absorption lines of the white paint
Hyperion Flight Validation . . . Dr. Carol Segal Hyperion Deputy Project Manager, Mission Operations TRW Space & Electronics
Hyperion Performance Verification • The On-orbit Performance Verification Plan was completed in preparation for the on-orbit 60 day checkout period:
On-Orbit Repeatability of Calibration Lamp VNIR Band 40: 752 nm SWIR Band 150: 1649 nm 3 2 Day 360 Day 344 1 associated with Solar Calibration Percent Difference Relative to Lamp Event 0 -1 Each point is coincident with a Data Collection Event (DCE) -2 -3 0 50 100 150 200 250 Minutes of Operation
Hyperion Image of Fairfax, VA December 2000 Image taken by Hyperion shows the relative chlorophyll content of vegetation in Fairfax County. The spectral profiles indicate healthy grass in the athletic field and golf course. The spectral profile of the trees indicates dormant vegetation. Dormant Trees Golf Course Turf Athletic Field Oxygen in the atmosphere is detected by the spectral profiles in the near infrared wavelength.
Geometric: Example VNIR Band 30: ~650 nm SWIR Band 85: ~993nm Cordoba Soybean False RGB, Red is healthy vegetation: 51,23,16 ~(864,578,507 nm) VNIR Band 40: ~752 nm SWIR Band 150: ~1649 nm
Tariquia, Bolivia Visible RGB False RGB Representing Pixel Purity