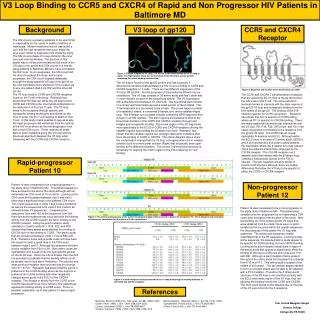
Analysis of CXCR4, PCAM, RANK, Mac1, and c-Kit Expression in Supplementary Figure 6
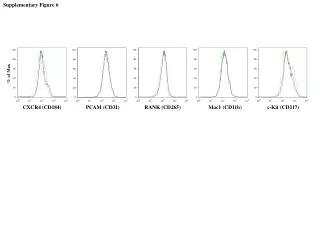
Supplementary Figure 6 illustrates the expression levels of key markers including CXCR4 (CD184), PCAM (CD31), RANK (CD265), Mac1 (CD11b), and c-Kit (CD117) across various conditions. The data is represented in a series of sequential graphs displaying percentages and relative intensities, which provide insights into the functional roles of these markers in cellular signaling and immune responses. This information is critical for understanding the biology of these receptors in disease contexts.

Analysis of CXCR4, PCAM, RANK, Mac1, and c-Kit Expression in Supplementary Figure 6
E N D
Presentation Transcript
Supplementary Figure 6 100 80 60 40 20 0 0 1 2 3 4 10 10 10 10 10 100 80 60 40 20 0 0 1 2 3 4 10 10 10 10 10 100 80 60 40 20 0 0 1 2 3 4 10 10 10 10 10 100 80 60 40 20 0 0 1 2 3 4 10 10 10 10 10 100 80 60 40 20 0 0 1 2 3 4 10 10 10 10 10 % of Max CXCR4 (CD184) PCAM (CD31) RANK (CD265) Mac1 (CD11b) c-Kit (CD117)