Download
1 / 25
250 likes | 387 Vues
Federal Reserve Bank of Chicago. An India/China Discussion. Global Automotive Sourcing. Chicago April 27, 2004. Summary. Motivations for global sourcing are varied – they need to be analysed in the context of business drivers (revenues, costs) and market impact (away vs. home)

E N D
Federal Reserve Bank of Chicago An India/China Discussion Global Automotive Sourcing Chicago April 27, 2004
Summary • Motivations for global sourcing are varied – they need to be analysed in the context of business drivers (revenues, costs) and market impact (away vs. home) • Nature of emerging Asian markets strongly differ from mature markets such as North America • Manufacturers need to follow a “build where you sell” strategy • Majority of Asian activity by manufacturers is for local market consumption • Two segments of global automotive sourcing – manufacturing and services • Manufacturing based exports (vehicles, components) from China/India growing rapidly but from a small base • Exploiting export opportunities requires careful study – to address supply chain, regulatory and economic factors • Services based exports very strong and growing – significant future growth expected • India appears to lead in engineering driven outsourcing; China competes on scale and cost • However, the automotive industry base in these countries is very fragmented and can be tough to navigate • A. T. Kearney’s 2004 Offshore Location Index ranks India and China are the top two destinations for services offshoring • Economic liberalization, improved connectivity, reduced cost of telecom in addition to large available pools of technical talent are driving outsourcing of services
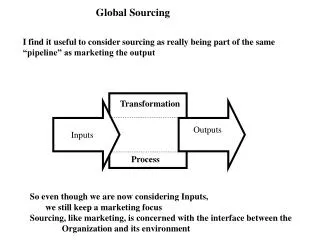
Motivations for global (low cost country) sourcing are varied Objectives Revenue Increase Grow New Markets Retain/Gain Market Share Vehicles Components Manufacturing Business Drivers Cost Decrease Compete Locally Improve Profitability Strategic Sourcing Vehicles Components IT/Business Process Engineering Services Emerging Markets Home Markets Manufacturing Services Impact on Markets
Asian markets are large and growing fast… Annual New Vehicle Volumes (MM) Annual New Vehicle Volumes (MM) CAGR Japan 1% CAGR 17% China NA 0.6% Asia 6.5% 0.9% Europe S. Korea 6% India 6% No automotive manufacturer can ignore emerging Asian economies Source: J.D. Power LMC; A.T. Kearney analysis
…and are different from North America … even different within Asia Product Segment Mix Product Segment Mix India Segment Market Share Segment Market Share Asia China North America Price Driven Segment Price Driven Segment Emerging Asian markets need location specific strategies Source: J.D. Power LMC; A.T. Kearney analysis
Manufacturers forced to follow a “build where you sell” strategy • Unit economics make exports into Asian regions difficult • Supply chain and regulatory constraints driving domestic emerging market investments • FDI • Technical Alliances • Captive units • JVs Average Retail Price Of new Car Note: 1) A.T. Kearney estimates Source: A.T. Kearney analysis
Domestic Export Hardly any vehicle exports out of India or China 2003 Volumes (MM) 3.7 • Capacity investments of U.S vehicle manufacturers in Asia primarily to exploit domestic markets • We are not aware of any OEMs planning to source vehicles out of emerging markets in Asia for the US market 0.98 0.9 Negligible Exports 0.08 • Vehicle exports from India primarily to S.E. Asia, Africa and some to Europe Source: Siam India, ACMA, Cris Infac, A.T. Kearney analysis
45 40 35 30 25 20 15 10 5 Exports of auto components growing rapidly…albeit from a low base Auto Component Market (Billions) Automotive Component Exports (% or total market in Millions) 44 3500 CAGR 3,242(9%) 36 China 41 % CAGR 30 2500 1,758(9%) China 24% 25 1,635 (11%) India 17 % 19 1500 1000(19%) 15 750(16%) India 10% 625(16%) 578(13%) 6.4 5.8 5.3 4.8 4.5 4.0 500 Note — US automotive material content: $240 Billion;Asian exports expected to grow at 15% – 20% per annum Source: Siam India, Automotive News, China automotive Industry yearbooks, National Bureau of Statistics, A.T. Kearney analysis
Wages in low cost countries is a major attraction… Average Manufacturing Industry Annual Wages (US $,2001) ? (1) Labour content varies significantly between components — need to consider capital — labour tradeoffs in addition to other cost elements Note: 1) Big 3 wages higher Source: SIAM, ACMA, Cris Infac
…however, exploiting sourcing opportunities requires careful study … Price Not Always Lower(1) Bolt Example (2) Shock Absorber Sourcing opportunities are real. Actual opportunities need tobe properly qualified — commodity by commodity Note: 1) Disguised data based on actual experience 2) Second US supplier Source: A.T. Kearney analysis
Favorable Not so favorable … allowing for the right tradeoffs India leading in engineering driven supply; China leading in cost efficiency Source: Frost & Sullivan
Component industry fragmentation very high … Illustrative Examples China Case Example Component-wise Export Value Break-up (India 2002) No clear dominant commodity or supplier strategy forcomponent sourcing from China/India
… with supply chain challenges Major Steps in Asian Supply Chain Factories Internal Local Transportation Consolidator Export Documentation Air/Ocean Carriers U.S. Customs Clearance De-consolidator Domestic U.S.Transportation • Suppliers? • Sites? • Supply base manage-ment? • Modes? • Carriers? • Control? • Where? • Which items? • Service levels? • Brokers? • Financial arrange-ments? • Service levels? • Ports? • Carriers? • Service levels? • Brokers? • Coordina-tion with transport-ation? • Where? • Service levels? • Cross-dock? • Store-ready? • Modes? • Carriers? • Service levels? Without effective supply chain management, sourcing in India and China can be challenging and sometimes costly
A.T. Kearney’s 2004 Offshore Location Attractiveness Index for services A.T. Kearney Offshore Location Attractiveness Index 2004 People Score Environment Score Financial Score India Chile Spain Israel China Brazil Russia Poland Mexico Ireland Turkey Canada Vietnam Portugal Hungary Thailand Malaysia Australia Singapore Argentina Costa Rica Philippines South Africa New Zealand Czech Republic While India, the Philippines and other popular locations continue to score highly, the Index suggests that a number of locations may be attractive, depending on the specific financial benefits, HR needs and risk profile that corporations are considering Source: A.T. Kearney analysis
25 countries attractive for services offhshoring covered in the index High Canada Singapore Ireland Australia New Zealand Spain India Czech Republic Combined People & Environment Score Portugal Israel Hungary Malaysia Poland Chile China Brazil South Africa Mexico Costa Rica Philippines Argentina Thailand Russia Turkey Vietnam Low Financial Score High Source: A.T. Kearney analysis
IT Services Customer Interaction Services Processing Services High End Customer and Analytical Services Design & Engineering Services Variety of services are being offshored Major Automotive Industry Applications and Interest – especially when combined with component outsourcing Example High Software Development Data Entry/Low-end Processing Software Maintenance & Upgrades Web-Chat Customer Service (e.g. Account Opening) Systems Integration 2D-3D Call Center Technical Help Desk Client Database Maintenance CAD Maturity of Supply Market Embedded Systems Level 1 CAE Accounts Receivable/ Payable Knowledge Based Engineering, Manufacturing Engineering Settlements & Payments Client Reporting & Statements Reconciliation Regulatory Audit Technical R&D Financial Reporting & Control Credit Analysis Level 2 Level 3 Low Research High Low Complexity of Function Source: A.T. Kearney client experience & analysis
Benefits of services offshoring are clear LessThan 10%Savings 6% Not As Good As The Original Services11% Better ThanThe Original Services14% Other2% No Savings0% GreaterThan 50% Savings 11% None5% AdditionalCapacity31% Prod.Improve26% 10-30%Savings 42% 31-50%Savings 41% ServiceQualityImprove15% Expand.Skills & Caps.21% As Good As the Original Services75% Better productivity, quality & skills as added benefits Typical cost savings range from 30 – 50% Quality consistent with on-shore services Source: 2003 A.T. Kearney Automotive Executive Survey
Three factors driving services offshoring ($ Millions) 1991 – 2001 CAGR = 46.7% 1985 – 1991 CAGR = -5.9% (CAGR: -30%) 180 Outside North America 140 100 60 North America 40 0 Economic liberalization, connectivity and drop in telecom costs have been key drivers Source: A.T. Kearney analysis
India and China provide a huge technical resource pool Undergraduate Engineering Enrollment Doctoral Degrees in Science and Engineering (1) ~350,000 N/A Globalization, so far, has leveraged the undergraduate engineering resource pool more than the doctoral level Note: 1) 1999 data Source: National Science Foundation
Sizeable industry benefits estimated from offshore services Financing Arms Suppliers OEMs $390 Billion $381 Billion $136.4 Billion 8 2% of Total Cost 10 2000 – 2015CAGR=26.5% 167 170 206 $9 Billion 2 210 $24.2 Billion 3 4 $4.0 Billion $3 Billion IndustrySavings 2002 US GDP — 10,500 Billion
Thank You! For More Information Contact Nagi Palle, Principal Taj Mahal Hotel, Suite 1001 One Mansingh Road New Delhi 110011 India Tel: + 91 11 2302 6162 Ext 1001 2000 Town Center, Suite 1600 Southfield, MI 48075 USA Tel: + 1 (248) 354 2226
Imported vehicle content Imported part content Approximately 60% of all U.S. vehicle content is imported from outside the U.S. U.S. Automotive Material Content, in USD Billion Imported Material Content, by Region Imported Content = 60% 242 Canada 26.5% Asia26.5% 146 Mexico 20.0% EU 25.8% 55% 45% Total Material Content Imported Material Content S. America 1.0% Source: A.T. Kearney analysis